 Global| Mar 08 2005
Small Business Optimism Unchanged
by:Tom Moeller
|in:Economy in Brief
Summary
The Small Business Optimism Index for February reported by the National Federation of Independent Business (NFIB) was unchanged versus January. The percentage of firms expecting the economy to improve fell further to 20% versus 47% [...]
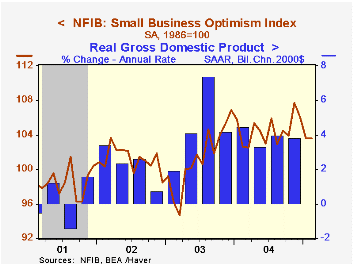
The Small Business Optimism Index for February reported by the National Federation of Independent Business (NFIB) was unchanged versus January. The percentage of firms expecting the economy to improve fell further to 20% versus 47% last November.
During the last ten years there has been a 64% correlation between the level of the NFIB index and the two quarter change in real GDP.
The percent of firms planning to raise employment rose slightly to 16%. During the last ten years there has been a 67% correlation between these hiring plans and the three month growth in nonfarm payrolls. The percentage of firms with one or more job openings rose to 24%, the highest level since 2001.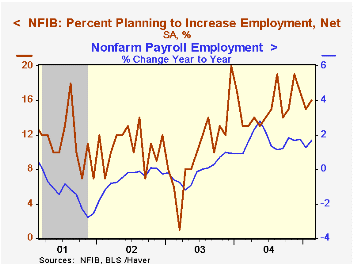
The percentage of firms planning to raise capital spending fell slightly to 33% roughly the average during 2004 but still up versus 29% in 2003.
The percentage of firms raising average selling prices rose to 19%, the highest since October.
About 24 million businesses exist in the United States. Small business creates 80% of all new jobs in America.
| Nat'l Federation of Independent Business | Feb | Jan | Y/Y | 2004 | 2003 | 2002 |
|---|---|---|---|---|---|---|
| Small Business Optimism Index (1986=100) | 103.6 | 103.6 | 1.0% | 104.6 | 101.3 | 101.2 |
by Tom Moeller March 8, 2005
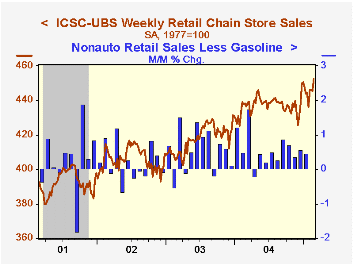
Chain store sales fell 0.4% last week. The slip followed a 1.5% surge the week prior according to the International Council of Shopping Centers (ICSC)-UBS survey.
Sales began March 0.7% ahead of the February average which rose 1.0% from January.
During the last ten years there has been a 59% correlation between y/y change in chain store sales and the change in non-auto retail sales less gasoline, as published by the US Census Department.
The leading indicator of chain store sales from ICSC was unchanged in the latest week (0.0% y/y), ending a six week stretch of erratic and mostly sideways movement. The indicator's February average rose 0.4% following a 0.6% January decline.
The ICSC-UBS retail chain-store sales index is constructed using the same-store sales (stores open for one year) reported by 78 stores of seven retailers: Dayton Hudson, Federated, Kmart, May, J.C. Penney, Sears and Wal-Mart.
| ICSC-UBS (SA, 1977=100) | 03/05/05 | 02/26/05 | Y/Y | 2004 | 2003 | 2002 |
|---|---|---|---|---|---|---|
| Total Weekly Chain Store Sales | 450.8 | 452.5 | 3.3% | 4.6% | 2.9% | 3.6% |

Tom Moeller
AuthorMore in Author Profile »Prior to joining Haver Analytics in 2000, Mr. Moeller worked as the Economist at Chancellor Capital Management from 1985 to 1999. There, he developed comprehensive economic forecasts and interpreted economic data for equity and fixed income portfolio managers. Also at Chancellor, Mr. Moeller worked as an equity analyst and was responsible for researching and rating companies in the economically sensitive automobile and housing industries for investment in Chancellor’s equity portfolio. Prior to joining Chancellor, Mr. Moeller was an Economist at Citibank from 1979 to 1984. He also analyzed pricing behavior in the metals industry for the Council on Wage and Price Stability in Washington, D.C. In 1999, Mr. Moeller received the award for most accurate forecast from the Forecasters' Club of New York. From 1990 to 1992 he was President of the New York Association for Business Economists. Mr. Moeller earned an M.B.A. in Finance from Fordham University, where he graduated in 1987. He holds a Bachelor of Arts in Economics from George Washington University.
More Economy in Brief


