 Global| Nov 09 2004
Small Business Optimism Backpedaled
by:Tom Moeller
|in:Economy in Brief
Summary
The October Small Business Optimism Index published by the National Federation of Independent Business (NFIB) fell 0.6%, reversed some of the prior month's 1.6% rise and continued the sideways trend of 2004. During the last ten years [...]
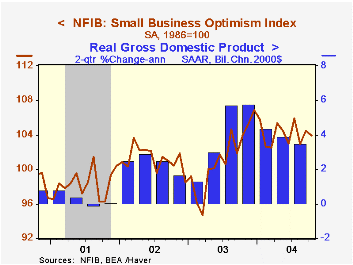
The October Small Business Optimism Index published by the National Federation of Independent Business (NFIB) fell 0.6%, reversed some of the prior month's 1.6% rise and continued the sideways trend of 2004.
During the last ten years there has been a 74% correlation between the level of the NFIB index and the two quarter change in real GDP.
The percentage of firms expecting the economy to improve fell sharply to 30%, the lowest since June, and the percentage of firms reporting that now is a good time to expand fell to 20%, a figure well off the highs of 24-25. 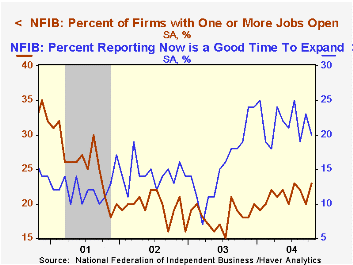
Despite the lost enthusiasm, the percent of firms planning to raise employment firmed slightly and the percentage of firms with one or more jobs open rose to the highest since July (23%). During the last ten years there has been a 63% correlation between these hiring plans and the three month growth in nonfarm payrolls.
The percentage of firms raising average selling prices rose slightly to 20%.
About 24 million businesses exist in the United States. Small business creates 80% of all new jobs in America.
| Nat'l Federation of Independent Business | Oct | Sept | Y/Y | 2003 | 2002 | 2001 |
|---|---|---|---|---|---|---|
| Small Business Optimism Index (1986=100) | 103.9 | 104.5 | -0.1% | 101.3 | 101.2 | 98.4 |
by Tom Moeller November 9, 2004
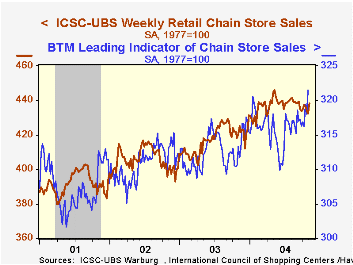
Last week, chain store sales jumped by 1.3% as consumer spending emerged from a three week skid which had pulled the October average 0.1% below September, according to the International Council of Shopping Centers (ICSC)-UBS.
The weekly increase was the largest since a 1.5% pop in late April and started the month 0.7% ahead of October.
During the last ten years there has been a 60% correlation between y/y change in chain store sales and the change in non-auto retail sales less gasoline.
Last week's sales increase was preceded by a 1.1% w/w increase in the leading indicator of chain store sales from ICSC.
The ICSC-UBS retail chain-store sales index is constructed using the same-store sales reported by 78 stores of seven retailers: Dayton Hudson, Federated, Kmart, May, J.C. Penney, Sears and Wal-Mart.
| ICSC-UBS (SA, 1977=100) | 11/06/04 | 10/30/04 | Y/Y | 2003 | 2002 | 2001 |
|---|---|---|---|---|---|---|
| Total Weekly Retail Chain Store Sales | 438.0 | 432.4 | 3.0% | 2.9% | 3.6% | 2.1% |

Tom Moeller
AuthorMore in Author Profile »Prior to joining Haver Analytics in 2000, Mr. Moeller worked as the Economist at Chancellor Capital Management from 1985 to 1999. There, he developed comprehensive economic forecasts and interpreted economic data for equity and fixed income portfolio managers. Also at Chancellor, Mr. Moeller worked as an equity analyst and was responsible for researching and rating companies in the economically sensitive automobile and housing industries for investment in Chancellor’s equity portfolio. Prior to joining Chancellor, Mr. Moeller was an Economist at Citibank from 1979 to 1984. He also analyzed pricing behavior in the metals industry for the Council on Wage and Price Stability in Washington, D.C. In 1999, Mr. Moeller received the award for most accurate forecast from the Forecasters' Club of New York. From 1990 to 1992 he was President of the New York Association for Business Economists. Mr. Moeller earned an M.B.A. in Finance from Fordham University, where he graduated in 1987. He holds a Bachelor of Arts in Economics from George Washington University.
More Economy in Brief


