 Global| Nov 15 2006
Slower U.S. Sales Require Slower Inventory Accumulation
by:Tom Moeller
|in:Economy in Brief
Summary
Total business inventories rose just 0.4% in September following an unrevised 0.6% rise during August. Consensus expectations had been for a 0.5% increase but together the increases during the last three months which averaged 0.6% [...]
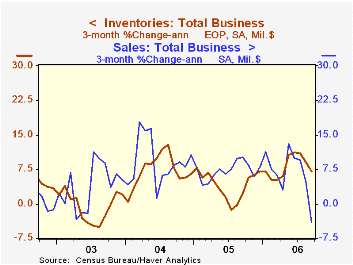
Total business inventories rose just 0.4% in September following an unrevised 0.6% rise during August. Consensus expectations had been for a 0.5% increase but together the increases during the last three months which averaged 0.6% were the slowest since April and the one month gain was the slowest since February.
During the last ten years there has been a 57% correlation between the y/y change in business inventories and the change in factory sector industrial production. Using quarterly figures, there has been an 84% correlation between the change in real private nonfarm inventories and production.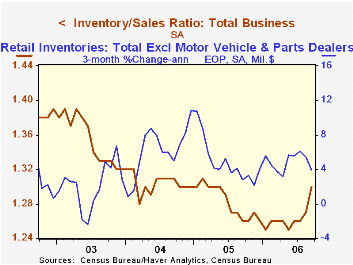
Business sales fell 2.0% (+4.9% y/y) due to the 3.5% m/m slide in factory shipments. In addition, retail sales fell 0.8% (+5.2% y/y) and wholesale sales fell 1.2% (+8.1% y/y). As a result the inventory to sales ratio surged to 1.30, the highest since March 2003.
Retail inventories fell 0.1% but excluding autos they rose 0.1%. That latter gain compared to monthly increases between 0.2% and 0.7% since March. General merchandise inventories increased 0.3% (0.9% y/y) after a 0.7% gain but accumulation of clothing store inventories accelerated to 0.7% (6.2% y/y). Furniture inventories rose 0.2% (4.9% y/y) after a 0.3% August decline.
Production and Inventory Behavior of Capital from the Federal Reserve Bank of St. Louis is available here.
| Business Inventories | September | August | Y/Y | 2005 | 2004 | 2003 |
|---|---|---|---|---|---|---|
| Total | 0.4% | 0.6% | 7.6% | 4.4% | 7.6% | -1.0% |
| Retail | -0.1% | 0.3% | 6.1% | 2.7% | 6.7% | 3.8% |
| Retail excl. Autos | 0.1% | 0.6% | 4.3% | 4.5% | 7.1% | 1.9% |
| Wholesale | 0.8% | 1.2% | 9.9% | 7.1% | 9.8% | 1.8% |
| Manufacturing | 0.6% | 0.6% | 7.4% | 4.0% | 6.9% | -7.4% |

Tom Moeller
AuthorMore in Author Profile »Prior to joining Haver Analytics in 2000, Mr. Moeller worked as the Economist at Chancellor Capital Management from 1985 to 1999. There, he developed comprehensive economic forecasts and interpreted economic data for equity and fixed income portfolio managers. Also at Chancellor, Mr. Moeller worked as an equity analyst and was responsible for researching and rating companies in the economically sensitive automobile and housing industries for investment in Chancellor’s equity portfolio. Prior to joining Chancellor, Mr. Moeller was an Economist at Citibank from 1979 to 1984. He also analyzed pricing behavior in the metals industry for the Council on Wage and Price Stability in Washington, D.C. In 1999, Mr. Moeller received the award for most accurate forecast from the Forecasters' Club of New York. From 1990 to 1992 he was President of the New York Association for Business Economists. Mr. Moeller earned an M.B.A. in Finance from Fordham University, where he graduated in 1987. He holds a Bachelor of Arts in Economics from George Washington University.
More Economy in Brief


