 Global| Dec 06 2006
Slower U.S. Factory Inventory Accumulation: Oil & Computers
by:Tom Moeller
|in:Economy in Brief
Summary
Factory inventories rose an even slower 0.4% during October, half the 0.8% average gain during the prior six months. It was the slowest increase since a 0.5% decline in inventories during February and the y/y rise ticked lower to [...]
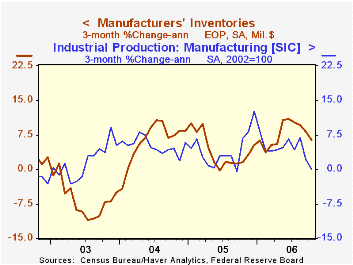
Factory inventories rose an even slower 0.4% during October, half the 0.8% average gain during the prior six months. It was the slowest increase since a 0.5% decline in inventories during February and the y/y rise ticked lower to 7.1%.
The slowdown has been mostly due to lower oil prices which in October were mostly responsible for a 4.9% (+5.6% y/y) decline in petroleum refineries' inventories. Less petroleum, factory inventories grew 0.7% (7.1% y/y) in October, equal to the average of the prior six months.
Inventories of computers & electronic products recovered 0.6% (8.7% y/y) after a 0.1% slip during September, though the latest figure reflected a 17.2% (-11.2% y/y) drop in computers. Primary metals inventories surged 1.6% (19.0% y/y) in October, though that was the slowest increase in four months. Inventories of electrical equipment rose 0.5% (10.9% y/y) after the 0.9% September drop yet the 3-month change fell to 5.2% (AR), half the rate of growth during the first nine months of 2006. Furniture inventories rose 1.1% and the 3-month change rose to 10.2% while machinery inventories increased 0.3% after a 1.6% September spike.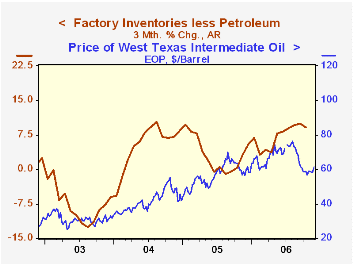
Total factory orders fell a hard 4.7% reflecting the 8.2% drop in durable goods orders which was little revised from the advance report. That reflected a 44.6% (+23.0% y/y) plunge in aircraft orders. Factory orders less transportation fell 0.8% (+1.4% y/y). Much of the recently slower growth in this measure reflects petroleum where orders (which equal shipments) fell 3.7% (-15.1% y/y) in October. Still, non-transportation orders less oil fell 0.6% (+3.3% y/y) in October for the third consecutive monthly decline.
Factory shipments rose 0.1%. Factory shipments less transportation & petroleum eked out a 0.4% (3.7% y/y) increase after a 2.6% September decline.
Unfilled orders rose another 1.2% due to a 2.4% (53.9% y/y) jump in civilian aircraft. Less the transportation sector altogether backlogs rose 1.0% (13.3% y/y).
| Factory Survey (NAICS) | October | September | Y/Y | 2005 | 2004 | 2003 |
|---|---|---|---|---|---|---|
| Inventories | 0.4% | 0.6% | 7.1% | 4.0% | 6.9% | -7.4% |
| New Orders | -4.7% | 1.7% | 0.6% | 8.5% | 7.5% | 0.9% |
| Shipments | 0.1% | -4.2% | 1.0% | 7.1% | 6.8% | 0.2% |
| Unfilled Orders | 1.2% | 4.1% | 21.9% | 16.3% | 4.5% | -1.0% |

Tom Moeller
AuthorMore in Author Profile »Prior to joining Haver Analytics in 2000, Mr. Moeller worked as the Economist at Chancellor Capital Management from 1985 to 1999. There, he developed comprehensive economic forecasts and interpreted economic data for equity and fixed income portfolio managers. Also at Chancellor, Mr. Moeller worked as an equity analyst and was responsible for researching and rating companies in the economically sensitive automobile and housing industries for investment in Chancellor’s equity portfolio. Prior to joining Chancellor, Mr. Moeller was an Economist at Citibank from 1979 to 1984. He also analyzed pricing behavior in the metals industry for the Council on Wage and Price Stability in Washington, D.C. In 1999, Mr. Moeller received the award for most accurate forecast from the Forecasters' Club of New York. From 1990 to 1992 he was President of the New York Association for Business Economists. Mr. Moeller earned an M.B.A. in Finance from Fordham University, where he graduated in 1987. He holds a Bachelor of Arts in Economics from George Washington University.
More Economy in Brief


