 Global| Oct 19 2004
September Industrial Production in Poland Up Strongly: Increases in Production in the New European Union Member [...]
Summary
Poland reported that the non seasonally adjusted index of industrial production in September was 9.25% above the year ago figure. The seasonally adjusted and working day adjusted data are not yet available, but the Haver seasonally [...]
Poland reported that the non seasonally adjusted index of industrial production in September was 9.25% above the year ago figure. The seasonally adjusted and working day adjusted data are not yet available, but the Haver seasonally adjusted data show an increase of 2.28% from August to September. Most of the other eastern and central European countries that have recently joined the European Union1 and the Euro Zone itself have yet to release September data.
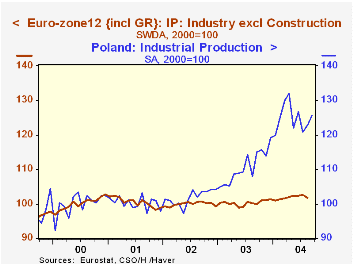
In the table below we show industrial production data for some of these countries and the Euro Zone as of August, 2004. All of the eastern and central European countries have shown good increases in production over the past few years. In the attached chart, we have taken Poland as representative of the central and eastern European countries and plotted its industrial production along with that of the Euro Zone. Industrial production for the Euro Zone as a whole has never been as much as 3% above its 2000 average in the past five years. In August of this year the index was 101.82, down 0.63% from July and only 1.61% above August 2003. The index for Poland, by contrast was 122.3 in August, that for Hungary, 120.0; that for Slovakia, 125.7;and that for the Czech Republic, 133.4.
| Industrial Production (SA) or (SAWD) (2000=100) | Aug 04 | Jul 04 | Aug 03 | M/M % | Y/Y % | 2003 | 2002 | 2001 |
|---|---|---|---|---|---|---|---|---|
| Poland | 122.3 | 123.2 | 111.7 | -0.73 | 9.49 | 110.5 | 102.1 | 100.7 |
| Hungary | 120.0 | 120.0 | 115.5 | 0.00 | 3.90 | 113.2 | 107.0 | 104.2 |
| Czech Republic | 133.4 | 138.9 | 122.5 | -3.96 | 8.90 | 123.4 | 116.0 | 106.8 |
| Slovakia | 125.7 | 122.6 | 117.2 | 2.53 | 7.25 | 120.9 | 114.8 | 107.6 |
| Euro Zone | 101.82 | 102.47 | 100.21 | -0.63 | 1.61 | 100.29 | 99.95 | 100.51 |
| Sep 04 | Aug 04 | Sep 03 | M/M % | Y/Y % | 2003 | 2002 | 2001 | |
| Poland NSA | 132.3 | 121.6 | 119.4 | 8.20 | 9.25 | 110.7 | 101.8 | 100.3 |
| Poland SA by Haver | 125.6 | 122.8 | 115.1 | 2.28 | 9.12 | 110.7 | 101.8 | 100.3 |
More Economy in Brief


