 Global| Jun 12 2003
Retail Sales Up, Less Autos & Gasoline Firm
by:Tom Moeller
|in:Economy in Brief
Summary
Retail sales rose an expected 0.1% in May following a 0.3% April decline. The April decline was revised deeper than the initially reported 0.1% drop due to a lowered number for motor vehicle sales. Sales excluding motor vehicles and [...]
Retail sales rose an expected 0.1% in May following a 0.3% April decline. The April decline was revised deeper than the initially reported 0.1% drop due to a lowered number for motor vehicle sales.
Sales excluding motor vehicles and parts dealers rose 0.1%, slightly less than expectations for a 0.3% gain. The April decline of 0.9% was unrevised.
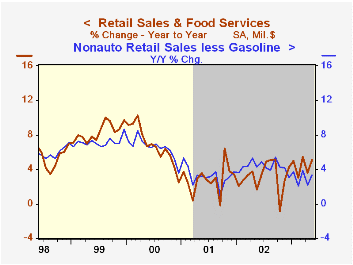
Sales at gasoline service stations fell 4.3%, down sharply for the second consecutive month. Retail gasoline prices fell 5.8% last month and are down another 1.0% so far in June. Excluding gasoline, nonauto retail sales rose 0.6% (+3.4% y/y) following an unrevised 0.4% April decline. So far in 2Q these sales are 2.1% (AR) higher than 1Q.
Sales gains were widespread last month. Furniture, home furnishing and electronics store sales surged 2.0% (3.8% y/y) following a 0.7% April gain, revised from a slight decline. Apparel and accessory store sales jumped 1.0% (2.1% y/y) following a 1.8% April decline that was revised shallower.
Sales at general merchandise stores rose 0.7% (3.6% y/y) following a little revised 0.7% April decline.
Motor vehicle dealers' sales fell 0.2% following sharp gains in the prior two months. Unit sales of light vehicles fell 2.3% last month to 16.12 mil. (AR).
| May | April | Y/Y | 2002 | 2001 | 2000 | |
|---|---|---|---|---|---|---|
| Retail Sales & Food Services | 0.1% | -0.3% | 5.1% | 3.2% | 2.9% | 6.7% |
| Excluding Autos | 0.1% | -0.9% | 3.5% | 3.7% | 2.9% | 7.4% |
by Tom Moeller June 12, 2003
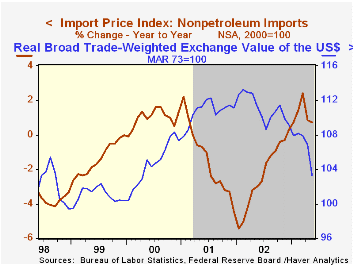
Prices for imported commodities fell 0.3% last month versus Consensus expectations for a 0.2% gain. The April decline in prices was revised deeper to 3.0%.
Petroleum import prices fell 1.1% last month for the third consecutive monthly decline. So far in June the price of Brent Crude Oil has been around $28.00 versus $25.62/bbl averaged in May.
Nonpetroleum import prices fell 0.2%. Price weakness was across the board for the second month. Food prices fell 1.0% (4.1% y/y) and industrial supplies and materials fell 0.7% (+7.2% y/y).
Prices of imported capital goods fell 0.4% (-1.7% y/y). Nonauto consumer goods prices were unchanged (-0.3% y/y) and have been flat since last year. Motor vehicle prices rose 0.1% (0.7% y/y) following two months of unchanged.
Export prices rose 0.1% (1.7% y/y) on the strength of a 3.1% (11.6% y/y) jump in food prices. Most other export prices were either flat or lower.
| Import/Export Prices (NSA) | May | April | Y/Y | 2002 | 2001 | 2000 |
|---|---|---|---|---|---|---|
| Import - All Commodities | -0.3% | -3.0% | 1.5% | -2.5% | -3.5% | 6.5% |
| Petroleum | -1.1% | -18.0% | 8.8% | 3.0% | -17.2% | 66.5% |
| Nonpetroleum | -0.2% | -1.0% | 0.7% | -2.4% | -1.5% | 1.0% |
| Export - All Commodities | 0.1% | -0.1% | 1.7% | -1.0% | -0.8% | 1.6% |
by Tom Moeller June 12, 2003
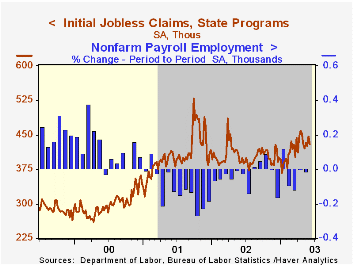
Initial claims for unemployment insurance fell 3.8% last week but the decline was from an upwardly revised level the prior week. Claims were higher than Consensus expectations for 425,000.
The four-week moving average of initial claims rose to 433,750 (+8.0% y/y).
During the last ten years there has been a 66% (inverse) correlation between the level of initial jobless insurance claims and the m/m change in nonfarm payrolls.
Continuing claims for unemployment insurance jumped 3.3% w/w but the prior week's level was revised down slightly.
The insured rate of unemployment rose to 3.0% from 2.9%.
| Unemployment Insurance (000s) | 6/07/03 | 5/31/03 | Y/Y | 2002 | 2001 | 2000 |
|---|---|---|---|---|---|---|
| Initial Claims | 430.0 | 447.0 | 10.0% | 404.3 | 406.0 | 299.7 |
| Continuing Claims | -- | 3,800 | 3.4% | 3,575 | 3,022 | 2,114 |
by Tom Moeller June 12, 2003
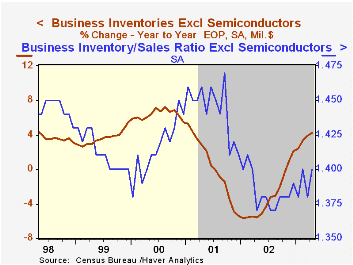
Total business inventories rose a slight 0.1% in April, less than Consensus expectations for a 0.2% gain. March figures were revised down slightly across the board.
Retail inventories rose 0.4%. Inventories of motor vehicles and parts again surged and are up 20.7% y/y.
Nonauto retail inventories fell for the first month since last October. Lower inventories of building materials, clothing and food led the decline. Inventories at general merchandise stores jumped 1.0% (5.4% y/y) following a 1.4% March gain. Inventories of furniture, home furnishings and electronics rose 0.2% (4.3% y/y), the first monthly gain since December.
Overall business sales dropped 1.5% (1.9% y/y) reflecting steep declines across the board.
The inventory-to-sales ratio rose to 1.40 from 1.38 in March and from 1.37 last April.
| Business Inventories | April | Mar | Y/Y | 2002 | 2001 | 2000 |
|---|---|---|---|---|---|---|
| Total | 0.1% | 0.3% | 4.2% | 2.1% | -5.4% | 5.4% |
| Retail | 0.4% | 0.7% | 9.0% | 7.6% | -2.9% | 6.0% |
| Retail excl. Autos | -0.0% | 0.4% | 3.7% | 2.5% | -1.2% | 3.7% |
| Wholesale | -0.1% | 0.4% | 2.8% | 0.4% | -4.9% | 6.1% |
| Manufacturing | 0.0% | -0.2% | 0.6% | -1.9% | -8.0% | 4.5% |

Tom Moeller
AuthorMore in Author Profile »Prior to joining Haver Analytics in 2000, Mr. Moeller worked as the Economist at Chancellor Capital Management from 1985 to 1999. There, he developed comprehensive economic forecasts and interpreted economic data for equity and fixed income portfolio managers. Also at Chancellor, Mr. Moeller worked as an equity analyst and was responsible for researching and rating companies in the economically sensitive automobile and housing industries for investment in Chancellor’s equity portfolio. Prior to joining Chancellor, Mr. Moeller was an Economist at Citibank from 1979 to 1984. He also analyzed pricing behavior in the metals industry for the Council on Wage and Price Stability in Washington, D.C. In 1999, Mr. Moeller received the award for most accurate forecast from the Forecasters' Club of New York. From 1990 to 1992 he was President of the New York Association for Business Economists. Mr. Moeller earned an M.B.A. in Finance from Fordham University, where he graduated in 1987. He holds a Bachelor of Arts in Economics from George Washington University.
More Economy in Brief


