 Global| Nov 13 2008
Recession & War Swell U.S. Budget Deficit
by:Tom Moeller
|in:Economy in Brief
Summary
To start Fiscal Year 2009, the U.S. government's budget deficit for October reflected the duel of effects from a U.S. recession and the War in Iraq.The monthly deficit jumped to $237.2B, more than four times last year's deficit of [...]
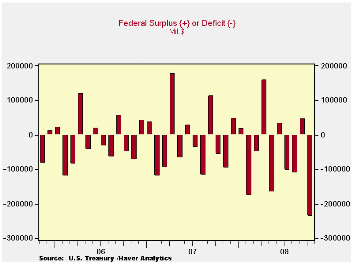
To start Fiscal Year 2009, the U.S. government's budget deficit for October reflected the duel of effects from a U.S. recession and the War in Iraq.The monthly deficit jumped to $237.2B, more than four times last year's deficit of $56.8B. October's figure also was more than double Consensus projections for a deficit of $99.2B.
Many forecasts for the budget deficit during all of this fiscal year are near $700B. If realized, that would swell the deficit to about 5% of GDP following last year's roughly 3.2% and FY07's marginal 1.2%.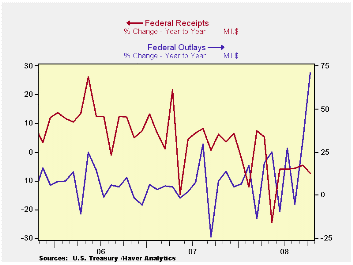
Net revenues during October suffered greatly and fell 7.5% from last year. Higher unemployment took the steam out of individual income tax receipts and they fell 9.7% from last October. Lingering payouts of the Government's "stimulus" checks reduced revenues somewhat. However the big negative factor would have been that payroll employment, and thus tax receipts, fell roughly 1.0% y/y. Suffering even more were corporate tax receipts which nearly evaporated with huge stated losses. Growth in unemployment and social insurance taxes grew a reduced 3.7%, the least since 2004.
U.S. government outlays nearly doubled versus last November lifted mostly by a jump in the "commerce & housing credit". Defense spending (19% of total outlays) rose an accelerated 17.9%. The gain does not reflect the full cost of the resources devoted to Iraq & Afghanistan since much of the spending would have occurred anyway. Medicare expenditures (12% of outlays) rose by nearly one-half but that followed an October decline Social security spending (21% of outlays) rose 6% after 6.8% growth last year. Net interest payments increased 4.3% y/y.
The Government's financial data are available in Haver's USECON database, with extensive detail available in the specialized GOVFIN.
| US Government Finance | October | September | Y/Y | FY 2008 | FY 2007 | FY 2006 |
|---|---|---|---|---|---|---|
| Budget Balance | -$237.2 | $45.7B | -$56.8B (10/07) |
-$454.8B | -$161.5B | -$248.2B |
| Net Revenues | $164.8B | $272.2B | -7.5% | -1.7% | 6.7% | 11.8% |
| Net Outlays | $402.0B | $226.5B | 71.1% | 9.1% | 2.8% | 7.4% |

Tom Moeller
AuthorMore in Author Profile »Prior to joining Haver Analytics in 2000, Mr. Moeller worked as the Economist at Chancellor Capital Management from 1985 to 1999. There, he developed comprehensive economic forecasts and interpreted economic data for equity and fixed income portfolio managers. Also at Chancellor, Mr. Moeller worked as an equity analyst and was responsible for researching and rating companies in the economically sensitive automobile and housing industries for investment in Chancellor’s equity portfolio. Prior to joining Chancellor, Mr. Moeller was an Economist at Citibank from 1979 to 1984. He also analyzed pricing behavior in the metals industry for the Council on Wage and Price Stability in Washington, D.C. In 1999, Mr. Moeller received the award for most accurate forecast from the Forecasters' Club of New York. From 1990 to 1992 he was President of the New York Association for Business Economists. Mr. Moeller earned an M.B.A. in Finance from Fordham University, where he graduated in 1987. He holds a Bachelor of Arts in Economics from George Washington University.
More Economy in Brief


