 Global| Feb 20 2003
Producer Prices Spiked
by:Tom Moeller
|in:Economy in Brief
Summary
Finished producer prices rose in January by the most for any one month since a 1.9% increase in January 1990. (That spike was followed by three months of decline.) Consensus expectations were for a 0.4% gain. Excluding food and energy [...]
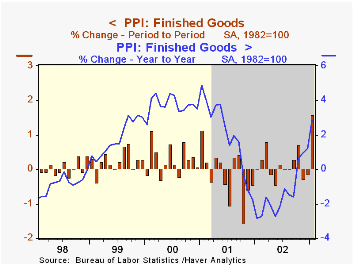
Finished producer prices rose in January by the most for any one month since a 1.9% increase in January 1990. (That spike was followed by three months of decline.) Consensus expectations were for a 0.4% gain.
Excluding food and energy prices also were stronger than expectations for a 0.1% increase. The 0.9% rise was the strongest monthly gain since a 1.0% jump in 1998. (That spike was followed by eight consecutive months of little change.)
Finished energy prices jumped 4.8% (17.2% y/y). Gasoline prices spiked 15.7% (52.5% y/y). Fuel oil prices rose 15.1% (62.4% y/y). Residential gas prices rose 3.9% (12.9% y/y). These energy product price series are NSA.
Core finished consumer goods prices rose a strong 0.9% (1.0% y/y) following two months of decline. Higher passenger car prices led the increase, up 3.2% (-1.4% y/y) following two months of sharp decline. Household appliance prices jumped 1.0% (-0.9% y/y) following four down months. Many other consumer durables prices were flat. Core nondurable goods prices rose 0.4% (1.8% y/y). Capital goods prices jumped 0.7% (-0.1% y/y) following two months of decline.
Intermediate goods prices surged by the most for any one month since 1990. Core intermediate prices rose moderately following the decline December.
Crude goods prices jumped the most since January 2001. Energy prices rose a strong 11.0% but it was a 5.2% spike in food prices that was most surprising. Core crude prices surged reflecting more strength in metals prices, notably for steel scrap which recovered after four down months.
| Producer Price Index | Jan | Dec | Y/Y | 2002 | 2001 | 2000 |
|---|---|---|---|---|---|---|
| Finished Goods | 1.6% | -0.1% | 1.8% | -1.3% | 2.0% | 3.7% |
| Core | 0.9% | -0.5% | 0.5% | 0.1% | 1.4% | 1.3% |
| Intermediate Goods | 1.3% | -0.2% | 4.5% | -1.5% | 0.4% | 4.9% |
| Core | 0.3% | -0.1% | 1.9% | -0.5% | -0.1% | 2.6% |
| Crude Goods | 6.9% | 2.2% | 28.9% | -10.5% | 0.3% | 22.8% |
| Core | 1.0% | 0.5% | 13.0% | 3.8% | -10.0% | 7.4% |
by Tom Moeller February 20, 2003
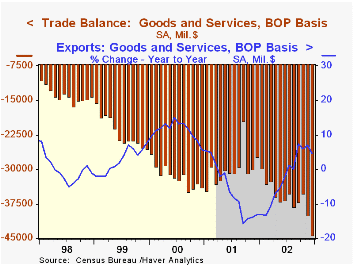
The U.S. foreign trade deficit deepened much more than expected in December. November's deficit was little revised. Consensus expectations had been for a December deficit of $38.5B.
Exports fell for the fourth month in five, and erased all of the prior month's gain. Lower exports of capital goods, down 9.1% (-5.6% y/y), led the drop. Nonauto consumer goods exports also fell 3.7% (-2.4% y/y) as did exports of other goods, down 3.8% (+3.9% y/y).
Imports surged to a near-record level. Capital goods imports rose 1.3% (9.9% y/y) following a 9.7% November gain. Imports of nonauto consumer goods added 0.3% (25.3% y/y) to a 10.9% November jump. Imports of industrial supplies & materials rose only modestly as the value of oil imports fell due to lower prices and values, perhaps a reflection of fewer imports from Venezuela.
| Foreign Trade | Dec | Nov | Y/Y | 2002 | 2001 | 2000 |
|---|---|---|---|---|---|---|
| Trade Deficit | $44.2B | $40.0B | $27.3B(12/01) | $435.2B | $358.3B | $378.7B |
| Exports - Goods & Services | -2.6% | 1.4% | 4.8% | -2.5% | -6.2% | 11.2% |
| Imports - Goods & Services | 1.7% | 5.0% | 19.7% | 3.8% | -6.0% | 18.3% |
by Tom Moeller February 20, 2003
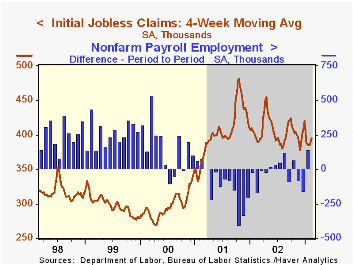
Initial claims for unemployment insurance rose more than expected last week. Claims rose 5.5% from the prior week's level which was revised up. The latest figure is for the February survey period for nonfarm payrolls. Claims were up 39,000 or roughly 10% from the January period.
The four-week moving average of initial claims rose to 394,750 (0.4% y/y).
Continuing claims for unemployment insurance surged 4.5% from the prior week's level which was revised down. It was the highest claimant level since mid-December.
The insured rate of unemployment rose slightly to 2.7%.
| Unemployment Insurance (000s) | 2/15/03 | 2/08/03 | Y/Y | 2002 | 2001 | 2000 |
|---|---|---|---|---|---|---|
| Initial Claims | 402.0 | 381.0 | 3.9% | 405.0 | 405.8 | 299.8 |
| Continuing Claims | -- | 3,444 | -2.7% | 3,588 | 3,021 | 2,114 |
by Tom Moeller February 20, 2003
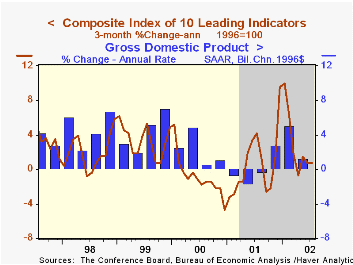
The Composite Index of Leading Economic Indicators reported by the Conference Board eased slightly last month, about as expected, following three up months. The prior month's reading was revised up slightly.
Gains amongst the leaders' component series narrowed significantly to 40%, the leanest breadth of gain since September.
Lower consumer expectations and lower building permits weighed the heaviest on the leading index. That was offset on the upside by lower claims for jobless insurance.
The ratio of coincident-to-lagging indicators rose again by 0.3%. The ratio is an indicator of excess relative to actual economic performance.
The coincident indicators rose to a level 0.2% above the 4Q average. During the last twenty years there has been an 80% correlation between the quarterly change in the coincident indicators and quarterly growth in real GDP.
The Leading index is based on eight previously reported economic data series and two that are estimated.
| Business Cycle Indicators | Jan | Dec | Y/Y | 2002 | 2001 | 2000 |
|---|---|---|---|---|---|---|
| Leading | -0.1% | 0.2% | 0.2% | 2.2% | -0.9% | 1.0% |
| Coincident | 0.2% | 0.0% | 0.8% | -0.2% | -0.4% | 3.4% |
| Lagging | -0.1% | -0.3% | -3.2% | -4.3% | -1.3% | 2.8% |
by Tom Moeller February 20, 2003
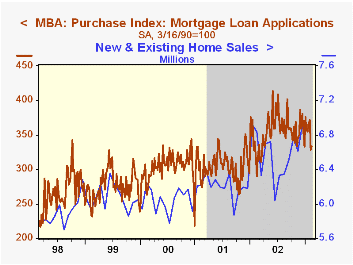
The index of mortgage applications compiled by the Mortgage Bankers Association were about unchanged last week. Applications were more than double the year ago level.
Mortgage applications to refinance fell for the fifth week in six but the decline was modest.
Mortgage applications for home purchase rose slightly following a sharp drop the prior week. Purchase applications have been trending lower since last Summer and are down nearly 20% from the July peak.
Interest rates on conventional 30 Year mortgages were about stable at 5.69%.
| MBA Mortgage Applications (3/16/90=100) | 2/14/03 | 2/07/03 | 2002 | 2001 | 2000 |
|---|---|---|---|---|---|
| Total Market Index | 1,082.8 | 1,083.1 | 799.7 | 625.6 | 322.7 |
| Purchase | 334.1 | 328.8 | 354.7 | 304.9 | 302.7 |
| Refinancing | 5,438.1 | 5,470.3 | 3,388.0 | 2,491.0 | 438.8 |
by Tom Moeller February 20, 2003
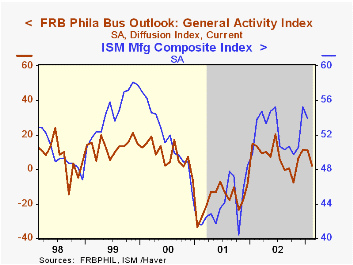
The Philadelphia Fed’s index of general business conditions weakened more than expected this month. The Business Activity Index fell to 2.3 versus Consensus expectations for stability at 11.0.
The decline was more modest than the decline in the Empire State Factory survey reported earlier this week but bodes poorly for the February ISM index.
Amongst the sub indexes, shipments, unfilled orders and the length of the workweek fell significantly. Orders fell only moderately and employment and inventories improved. Pricing strengthened.
The business conditions index reflects a separate survey question, not the components.
The Philadelphia Fed index is based on a survey of 250 regional manufacturing firms, but these firms sell nationally and internationally.
During the last ten years there has been a 64% correlation between the level of the General Activity Index and annual growth in real GDP.
For a discussion of the Philadelphia Fed's Business Outlook Survey click here.
| Philadelphia Fed Business Outlook | Feb | Jan | Y/Y | 2002 | 2001 | 2000 |
|---|---|---|---|---|---|---|
| General Activity Index | 2.3 | 11.2 | 13.5 | 7.7 | -17.2 | 8.3 |
| Prices Paid Index | 16.2 | 11.6 | -5.4 | 12.2 | -0.9 | 27.2 |

Tom Moeller
AuthorMore in Author Profile »Prior to joining Haver Analytics in 2000, Mr. Moeller worked as the Economist at Chancellor Capital Management from 1985 to 1999. There, he developed comprehensive economic forecasts and interpreted economic data for equity and fixed income portfolio managers. Also at Chancellor, Mr. Moeller worked as an equity analyst and was responsible for researching and rating companies in the economically sensitive automobile and housing industries for investment in Chancellor’s equity portfolio. Prior to joining Chancellor, Mr. Moeller was an Economist at Citibank from 1979 to 1984. He also analyzed pricing behavior in the metals industry for the Council on Wage and Price Stability in Washington, D.C. In 1999, Mr. Moeller received the award for most accurate forecast from the Forecasters' Club of New York. From 1990 to 1992 he was President of the New York Association for Business Economists. Mr. Moeller earned an M.B.A. in Finance from Fordham University, where he graduated in 1987. He holds a Bachelor of Arts in Economics from George Washington University.
More Economy in Brief


