 Global| Nov 15 2002
Producer Prices Rocket Higher
by:Tom Moeller
|in:Economy in Brief
Summary
Finished producer prices surged by the most for any month since September 1990, powered by higher energy prices. Consensus expectations were for a 0.2% gain. Excluding food and energy prices also rose much more than expectations for a [...]
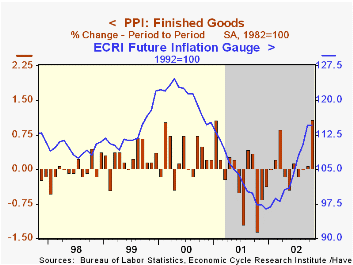
Finished producer prices surged by the most for any month since September 1990, powered by higher energy prices. Consensus expectations were for a 0.2% gain.
Excluding food and energy prices also rose much more than expectations for a 0.1% gain, driven by higher prices for passenger cars. Core producer prices were up 0.2% (AR) year to date.
Energy prices surged 4.2% (15.3% AR, YTD). Gasoline prices jumped 10.9% (86.5% AR) and fuel oil prices were strong for the fourth consecutive month (72.6% AR, YTD). Residential gas prices also rose a strong 3.5% but the YTD gain was a relatively low 4.0% (AR). These energy product price series are NSA.
Core finished consumer goods prices rose 0.6% (0.6% AR, YTD). Consumer durables prices jumped 0.8% on the rise in car prices. Gains in other consumer durables prices were relatively modest or negative. Core nondurable goods prices rose a firm 0.4% (1.4% AR, YTD) due to higher apparel prices. Capital goods prices rose 0.4% (-0.3% AR, YTD), the most for any month since October 1999.
Food prices rose a firm 0.7% (-1.5% AR, YTD) following three consecutive months of decline.
Intermediate goods prices were strong due to higher petroleum prices. Core intermediate prices rose just 0.1% for the second consecutive month (1.8% AR, YTD).
Crude goods prices jumped (21.5% AR, YTD) reflecting higher energy prices. Other commodities prices reflected in the core crude price measure also surged reflecting higher scrap metals prices.
| Producer Price Index | Oct | Sept | Y/Y | 2001 | 2000 | 1999 |
|---|---|---|---|---|---|---|
| Finished Goods | 1.1% | 0.1% | 0.6% | 2.0% | 3.7% | 1.8% |
| Core | 0.5% | 0.1% | 0.5% | 1.4% | 1.3% | 1.7% |
| Intermediate Goods | 0.7% | 0.5% | 1.7% | 0.4% | 4.9% | 0.1% |
| Core | 0.1% | 0.1% | 1.0% | -0.1% | 2.6% | -0.3% |
| Crude Goods | 3.4% | 0.6% | 14.5% | 0.3% | 22.8% | 1.5% |
| Core | 0.9% | -0.6% | 10.9% | -9.9% | 7.3% | -4.7% |
by Tom Moeller November 15, 2002
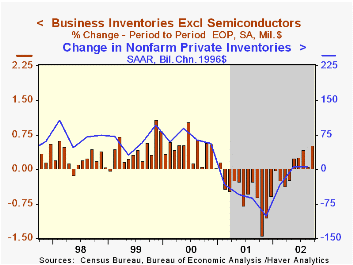
Total business inventories rose more than double Consensus expectations for September. August figures were revised back to positive due to raised figures for nonauto retail inventories.
Retail inventories (7.0% YTD, AR) surged, led by a 2.0% jump in motor vehicle inventories. Nonauto retail inventories (2.5% YTD, AR) rose strongly.
Inventories of furniture & home furnishings rose 1.8% and have been steadily accumulating (12.0% YTD, AR) since September. Inventories at apparel stores (4.1% YTD, AR) also jumped 0.9%. At general merchandise stores (-1.1% YTD, AR), inventories rose a modest 0.2%.
Overall business sales declined 0.5% (4.4% YTD, AR), the first monthly decline since May.
The inventory-to-sales ratio rose slightly to 1.36 from a record low level.
| Business Inventories | Sept | Aug | Y/Y | 2001 | 2000 | 1999 |
|---|---|---|---|---|---|---|
| Total | 0.5% | 0.1% | -2.4% | -6.3% | 5.6% | 5.4% |
| Retail | 1.1% | -0.0% | 1.5% | -5.0% | 6.1% | 7.7% |
| Retail excl. Autos | 0.6% | 0.1% | 1.0% | -2.0% | 4.1% | 5.7% |
| Wholesale | 0.5% | 0.1% | -3.4% | -5.5% | 6.6% | 6.0% |
| Manufacturing | 0.0% | 0.1% | -5.2% | -8.0% | 4.5% | 3.1% |
by Tom Moeller November 15, 2002
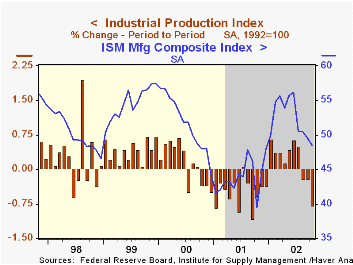
Industrial production slumped in October versus Consensus expectations for a moderate 0.3% decline. September's decline was deepened slightly. October was the third consecutive monthly decline in output. Production was up 2.3% (AR) year to date.
Output in the manufacturing sector fell 0.7% (2.0% AR, YTD) and September's previously reported 0.2% decline was doubled. It was the third consecutive monthly decline in factory output.
Sharply lower motor vehicle and parts output (5.2% AR, YTD) led the factory sector decline, off sharply for the second consecutive month. Output of furniture & fixtures fell 2.3% following an upwardly revised 1.0% September gain. Apparel output fell sharply for the second month in three
Output of business equipment fell 2.0% (-3.8% AR, YTD) following a steep September decline. Output of information processing equipment rose 0.1% after a sharp 0.5% September decline that was revised from a slight gain.
Capacity utilization fell sharply to the lowest level since March. Capacity again rose 0.1%(1.0% AR, YTD) as it has since early last year.
| Production & Capacity | Oct | Sept | Y/Y | 2001 | 2000 | 1999 |
|---|---|---|---|---|---|---|
| Industrial Production | -0.8% | -0.2% | 1.2% | -3.7% | 4.5% | 3.7% |
| Capacity Utilization | 75.2% | 75.8% | 75.0%(10/01) | 76.8% | 81.8% | 81.4% |
by Tom Moeller November 15, 2002
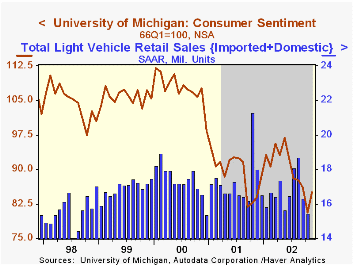
The preliminary reading of Consumer Sentiment for November rose a surprising 5.5% from October according to the University of Michigan. The figure was versus the Consensus expectation of a rise in the index level to 82.0.
Indexes of current conditions and expectations both rose, the latter sharply.
The University of Michigan survey is not seasonally adjusted.
| University of Michigan | Prelim. Nov | Oct | Y/Y | 2001 | 2000 | 1999 |
|---|---|---|---|---|---|---|
| Consumer Sentiment | 85.0 | 80.6 | 1.3% | 89.2 | 107.6 | 105.8 |
by Tom Moeller November 15, 2002
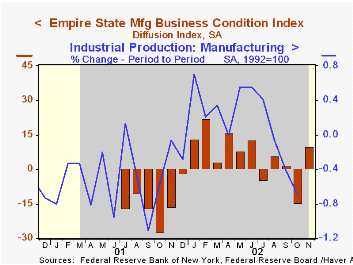
The Empire State Manufacturing Survey reported that the index of general business conditions improved in November.
The Empire State Manufacturing Survey is a monthly survey of manufacturers in New York State conducted by the Federal Reserve Bank of New York. Participants from across the state in a variety of industries respond to a questionnaire and report the change in a variety of indicators from the previous month. Respondents also state the likely direction of these same indicators six months ahead. April 2002 is the first report, although survey data date back to July 2001.
Like the Philadelphia Fed Index of General Business Conditions, the Empire State Business Conditions Index reflects answers to an independent survey question, not components.
Diffusion indexes for employment, new orders, and shipments improved. Indexes of prices paid and received both fell.
For the latest Empire State Manufacturing Survey report, click here.
| Empire State Manufacturing Survey | Nov | Oct | Y/Y | 2001 |
|---|---|---|---|---|
| General business conditions (diffusion index) | 9.64 | -14.61 | -16.39 | -14.97 |

Tom Moeller
AuthorMore in Author Profile »Prior to joining Haver Analytics in 2000, Mr. Moeller worked as the Economist at Chancellor Capital Management from 1985 to 1999. There, he developed comprehensive economic forecasts and interpreted economic data for equity and fixed income portfolio managers. Also at Chancellor, Mr. Moeller worked as an equity analyst and was responsible for researching and rating companies in the economically sensitive automobile and housing industries for investment in Chancellor’s equity portfolio. Prior to joining Chancellor, Mr. Moeller was an Economist at Citibank from 1979 to 1984. He also analyzed pricing behavior in the metals industry for the Council on Wage and Price Stability in Washington, D.C. In 1999, Mr. Moeller received the award for most accurate forecast from the Forecasters' Club of New York. From 1990 to 1992 he was President of the New York Association for Business Economists. Mr. Moeller earned an M.B.A. in Finance from Fordham University, where he graduated in 1987. He holds a Bachelor of Arts in Economics from George Washington University.
More Economy in Brief


