 Global| Jan 14 2005
Producer Prices Fell in December, Core Tame
by:Tom Moeller
|in:Economy in Brief
Summary
The PPI for finished goods fell 0.7% in December, reversed all of the prior month's gain and dropped more than Consensus expectations for a 0.1% dip. The indication of tame pricing power extended to a 0.1% rise in prices less food & [...]
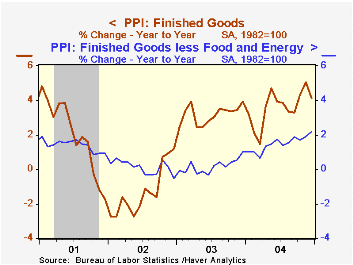
The PPI for finished goods fell 0.7% in December, reversed all of the prior month's gain and dropped more than Consensus expectations for a 0.1% dip. The indication of tame pricing power extended to a 0.1% rise in prices less food & energy which was half the Consensus expectation and the weakest figure since July.
Finished energy prices fell whopping 4.0% (+13.5% y/y) as gasoline prices fell 14.4% (+27.4% y/y), fuel oil prices fell 10.0% (+41.0% y/y) and residential natural gas prices slipped 0.2% (+15.7% y/y).
Though the trend in prices less food & energy firmed last year, the gain in December was under control as a 0.1% (2.0% y/y) rise in core finished consumer goods was the weakest since August. Unchanged or lower prices for apparel, passenger cars (+1.7% y/y), toys (+1.0% y/y) and furniture (+3.4% y/y) offset gains in prices for books (+4.6% y/y) and home electronics (-5.5% y/y). Finished capital goods prices also rose a modest 0.1% (2.4% y/y), the weakest gain since July.
Finished food prices also were well behaved. The 0.1% (2.9% y/y) gain was the weakest since September.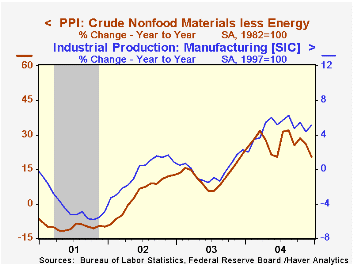
Intermediate goods prices fell for the first time in over a year. The 0.3% decline reflected a 3.8% (+14.7% y/y) drop in energy prices but a 0.8% (-1.9% y/y) gain in food prices. Core intermediate prices rose a firm 0.5% reflecting strength across categories, although recent weakness in housing construction has eased the earlier pressure on wood prices.
Crude prices slumped 2.9% as lower oil prices pulled crude energy prices down 7.3% (+37.3% y/y). The 1.7% decline in core crude prices reflected lower prices for iron & steel scrap (+48.6% y/y) but prices for copper scrap rose (35.5% y/y) as did aluminum scrap prices (+12.3 y/y). During the last thirty years "core" crude prices have been a fair indicator of industrial sector activity with a 48% correlation between the six month change in core crude prices and the change in factory sector industrial production.
| Producer Price Index | Dec | Nov | Y/Y | 2004 | 2003 | 2002 |
|---|---|---|---|---|---|---|
| Finished Goods | -0.7% | 0.5% | 4.1% | 3.6% | 3.2% | -1.3% |
| Core | 0.1% | 0.2% | 2.2% | 1.5% | 0.2% | 0.1% |
| Intermediate Goods | -0.3% | 0.8% | 9.0% | 6.6% | 4.7% | -1.5% |
| Core | 0.5% | 0.4% | 8.3% | 5.7% | 2.0% | -0.5% |
| Crude Goods | -2.9% | 8.7% | 18.2% | 17.6 | 25.1% | -10.6% |
| Core | -1.7% | 2.5% | 20.4% | 26.5% | 12.4% | 3.8% |

Tom Moeller
AuthorMore in Author Profile »Prior to joining Haver Analytics in 2000, Mr. Moeller worked as the Economist at Chancellor Capital Management from 1985 to 1999. There, he developed comprehensive economic forecasts and interpreted economic data for equity and fixed income portfolio managers. Also at Chancellor, Mr. Moeller worked as an equity analyst and was responsible for researching and rating companies in the economically sensitive automobile and housing industries for investment in Chancellor’s equity portfolio. Prior to joining Chancellor, Mr. Moeller was an Economist at Citibank from 1979 to 1984. He also analyzed pricing behavior in the metals industry for the Council on Wage and Price Stability in Washington, D.C. In 1999, Mr. Moeller received the award for most accurate forecast from the Forecasters' Club of New York. From 1990 to 1992 he was President of the New York Association for Business Economists. Mr. Moeller earned an M.B.A. in Finance from Fordham University, where he graduated in 1987. He holds a Bachelor of Arts in Economics from George Washington University.
More Economy in Brief


