 Global| Aug 17 2005
Producer Prices Doubled Expectations
by:Tom Moeller
|in:Economy in Brief
Summary
In July a 1.0% rise in the producer price index for finished goods was double Consensus expectations for a 0.5% increase, though it followed no change in prices one month earlier. Also double Consensus expectations was the 0.4% gain [...]
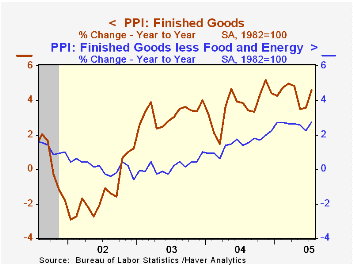
In July a 1.0% rise in the producer price index for finished goods was double Consensus expectations for a 0.5% increase, though it followed no change in prices one month earlier.
Also double Consensus expectations was the 0.4% gain in prices excluding food & energy prices which followed a slight decline in June.
The surprise stemmed mostly from a 1.5% increase in passenger car prices versus the 1.0% decline tallied by the survey of consumer prices. The gain lifted core finished consumer good prices 0.4% (+2.9% y/y). Consumer durable goods prices increased 0.6% (1.6% y/y) and core consumer nondurable goods prices rose 0.2% (3.8% y/y).
Capital goods prices also rose a strong 0.5% (2.6% y/y) due to a 1.4% (-1.8% y/y) jump in light truck prices as well as a 1.0% (6.1% y/y) surge in civilian aircraft.
Finished energy prices doubled the prior month's increase and rose 4.4% (15.2% y/y) lifted by a 10.9% (29.6% y/y) surge in gasoline prices, a 3.7% (11.1% y/y) increase in natural gas and a 5.1% (58.6% y/y) spike in home heating oil.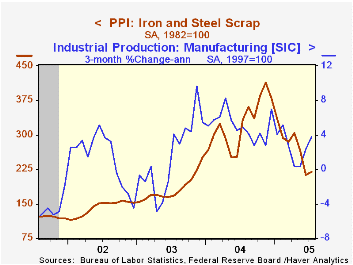
Intermediate goods prices also rose a strong 1.0% due to strength in energy prices, up 5.2%. Core intermediate goods prices, however, declined for the third consecutive month. The 0.1% decline in July was led by lower prices for containers and durable manufacturing materials which fell for the fifth consecutive month.
Crude prices reflected the strength in energy prices, up 12.8%, and rose 6.7%. Core crude prices also were strong following two months of sharp decline. Iron & steel scrap prices rose 2.7% (-34.2% y/y) but they are down 46.8% from the peak last November. During the last thirty years "core" crude prices have been a fair indicator of industrial sector activity with a 48% correlation between the six month change in core crude prices and the change in factory sector industrial production.
The Monetary Policy Transmission Mechanism? from the Federal Reserve Bank of St. Louis is available here.
| Producer Price Index | July | June | Y/Y | 2004 | 2003 | 2002 |
|---|---|---|---|---|---|---|
| Finished Goods | 1.0% | 0.0% | 4.6% | 3.6% | 3.2% | -1.3% |
| Core | 0.4% | -0.1% | 2.8% | 1.5% | 0.2% | 0.1% |
| Intermediate Goods | 1.0% | 0.1% | 6.5% | 6.6% | 4.6% | -1.5% |
| Core | -0.1% | -0.2% | 4.3% | 5.7% | 2.0% | -0.5% |
| Crude Goods | 6.7% | -3.3% | 8.5% | 17.5% | 25.1% | -10.6% |
| Core | 3.1% | -4.3% | -2.2% | 26.6% | 12.4% | 3.8% |

Tom Moeller
AuthorMore in Author Profile »Prior to joining Haver Analytics in 2000, Mr. Moeller worked as the Economist at Chancellor Capital Management from 1985 to 1999. There, he developed comprehensive economic forecasts and interpreted economic data for equity and fixed income portfolio managers. Also at Chancellor, Mr. Moeller worked as an equity analyst and was responsible for researching and rating companies in the economically sensitive automobile and housing industries for investment in Chancellor’s equity portfolio. Prior to joining Chancellor, Mr. Moeller was an Economist at Citibank from 1979 to 1984. He also analyzed pricing behavior in the metals industry for the Council on Wage and Price Stability in Washington, D.C. In 1999, Mr. Moeller received the award for most accurate forecast from the Forecasters' Club of New York. From 1990 to 1992 he was President of the New York Association for Business Economists. Mr. Moeller earned an M.B.A. in Finance from Fordham University, where he graduated in 1987. He holds a Bachelor of Arts in Economics from George Washington University.
More Economy in Brief


