 Global| Feb 17 2006
Producer Price Index Firm
by:Tom Moeller
|in:Economy in Brief
Summary
The 0.3% increase in the January Producer Price Index for Finished Goods again outpaced Consensus expectations which had been for a 0.2% rise, although the huge 0.9% rise previously reported for December was revised lower to 0.6%. [...]
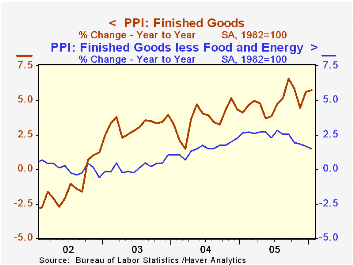
The 0.3% increase in the January Producer Price Index for Finished Goods again outpaced Consensus expectations which had been for a 0.2% rise, although the huge 0.9% rise previously reported for December was revised lower to 0.6%.
Producer prices less food & energy also were (quite a bit) stronger than expectations for a 0.2% advance and rose 0.4%. The source of the upside surprise was concentrated in a 1.1% (-2.8% y/y) gain in passenger car prices and a 0.7% (-4.8% y/y) rise in light motor trucks. Civilian aircraft prices also rose a strong 0.7% (4.3% y/y).
Prices of all finished consumer goods less food & energy rose 0.4% (1.6% y/y) and core consumer nondurable goods prices gained 0.3% (2.8% y/y). Capital equipment prices increased 0.3% (1.4% y/y).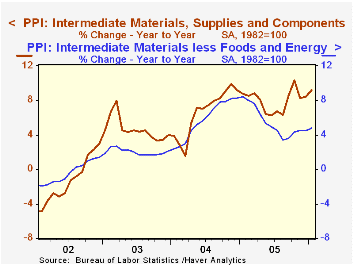
Finished energy prices were unchanged (25.1% y/y) in January as gasoline prices fell 3.5% (+40.5% y/y) and fuel oil prices fell 0.1% (+36.5% y/y). These declines were offset by residential electric power costs which rose 3.0% (9.2% y/y) and natural gas, up 0.8% (31.3% y/y).
Intermediate goods prices posted the strongest increase since October with a 1.2% gain led by a 1.0% rise in prices for core intermediate goods.
Crude goods prices fell for the third straight month. The 0.5% drop mostly reflected a 3.0% (-3.8% y/y) decline in food prices. Core crude prices slipped marginally after an upwardly revised 0.5% December increase. During the last thirty years "core" crude prices have been a fair indicator of industrial sector activity with a 48% correlation between the six month change in core crude prices and the change in factory sector industrial production.
| Producer Price Index | Jan | Dec | Y/Y | 2005 | 2004 | 2003 |
|---|---|---|---|---|---|---|
| Finished Goods | 0.3% | 0.6% | 5.7% | 4.9% | 3.6% | 3.2% |
| Core | 0.4% | 0.1% | 1.5% | 2.4% | 1.5% | 0.2% |
| Intermediate Goods | 1.2% | 0.1% | 9.2% | 8.0% | 6.6% | 4.6% |
| Core | 1.0% | 0.3% | 4.8% | 5.5% | 5.7% | 2.0% |
| Crude Goods | -0.5% | -2.3% | 22.4% | 14.6% | 17.5% | 25.1% |
| Core | -0.1% | 0.5% | 6.0% | 4.9% | 26.5% | 12.4% |

Tom Moeller
AuthorMore in Author Profile »Prior to joining Haver Analytics in 2000, Mr. Moeller worked as the Economist at Chancellor Capital Management from 1985 to 1999. There, he developed comprehensive economic forecasts and interpreted economic data for equity and fixed income portfolio managers. Also at Chancellor, Mr. Moeller worked as an equity analyst and was responsible for researching and rating companies in the economically sensitive automobile and housing industries for investment in Chancellor’s equity portfolio. Prior to joining Chancellor, Mr. Moeller was an Economist at Citibank from 1979 to 1984. He also analyzed pricing behavior in the metals industry for the Council on Wage and Price Stability in Washington, D.C. In 1999, Mr. Moeller received the award for most accurate forecast from the Forecasters' Club of New York. From 1990 to 1992 he was President of the New York Association for Business Economists. Mr. Moeller earned an M.B.A. in Finance from Fordham University, where he graduated in 1987. He holds a Bachelor of Arts in Economics from George Washington University.
More Economy in Brief


