 Global| Jun 14 2005
PPI Unexpectedly Down Sharply
by:Tom Moeller
|in:Economy in Brief
Summary
The 0.6% decline in the May Producer Price Index for finished goods was triple Consensus expectations for a 0.2% fall and the 0.1% increase in prices excluding food & energy also was half the Consensus expectation. Finished energy [...]
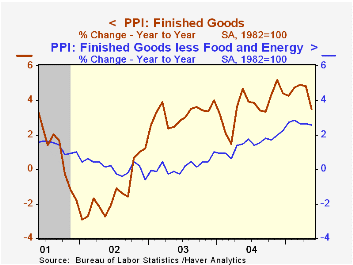
The 0.6% decline in the May Producer Price Index for finished goods was triple Consensus expectations for a 0.2% fall and the 0.1% increase in prices excluding food & energy also was half the Consensus expectation.
Finished energy prices dropped 3.5% (+10.1% y/y) due to a 2.7% (+12.5% y/y) decline in gasoline and a 3.9% drop in fuel oil (44.4% y/y). Finished food prices also fell by 0.3% (+0.8% y/y).
Prices for finished consumer goods less food & energy rose a modest 0.1% (2.6% y/y). Consumer durable goods prices slipped 0.1% (+1.3% y/y) while core consumer nondurable goods prices rose 0.3% (3.6% y/y).
Capital goods prices ticked 0.1% (2.6% y/y) higher.
Intermediate goods prices fell hard due to a 2.6% (+14.0% y/y) drop in energy prices though food prices rose a moderate 0.4% (-8.4% y/y). The decline in core intermediate goods prices was the first since 2003.
Crude prices slumped with oil prices which pulled crude energy prices down 1.9% (+20.1% y/y) after a 7.2% jump in April. The 3.6% crater in core crude prices reversed more than all of the gains during the prior two months as metals prices fell sharply. During the last thirty years "core" crude prices have been a fair indicator of industrial sector activity with a 48% correlation between the six month change in core crude prices and the change in factory sector industrial production.
| Producer Price Index | May | April | Y/Y | 2004 | 2003 | 2002 |
|---|---|---|---|---|---|---|
| Finished Goods | -0.6% | 0.6% | 3.5% | 3.6% | 3.2% | -1.3% |
| Core | 0.1% | 0.3% | 2.6% | 1.5% | 0.2% | 0.1% |
| Intermediate Goods | -0.7% | 0.8% | 6.4% | 6.6% | 4.6% | -1.5% |
| Core | -0.3% | 0.2% | 5.4% | 5.7% | 2.0% | -0.5% |
| Crude Goods | -2.0% | 2.7% | 6.1% | 17.5% | 25.1% | -10.6% |
| Core | -3.6% | 0.8% | 9.5% | 26.6% | 12.4% | 3.8% |

Tom Moeller
AuthorMore in Author Profile »Prior to joining Haver Analytics in 2000, Mr. Moeller worked as the Economist at Chancellor Capital Management from 1985 to 1999. There, he developed comprehensive economic forecasts and interpreted economic data for equity and fixed income portfolio managers. Also at Chancellor, Mr. Moeller worked as an equity analyst and was responsible for researching and rating companies in the economically sensitive automobile and housing industries for investment in Chancellor’s equity portfolio. Prior to joining Chancellor, Mr. Moeller was an Economist at Citibank from 1979 to 1984. He also analyzed pricing behavior in the metals industry for the Council on Wage and Price Stability in Washington, D.C. In 1999, Mr. Moeller received the award for most accurate forecast from the Forecasters' Club of New York. From 1990 to 1992 he was President of the New York Association for Business Economists. Mr. Moeller earned an M.B.A. in Finance from Fordham University, where he graduated in 1987. He holds a Bachelor of Arts in Economics from George Washington University.
More Economy in Brief


