 Global| Apr 22 2004
PPI Goosed By Food & Light Trucks
by:Tom Moeller
|in:Economy in Brief
Summary
Finished producer prices jumped 0.5% higher last month following a 0.1% February uptick. The surge matched consensus expectations. The core PPI also rose a moderate 0.2% following the 0.1% February rise. A 0.1% increase in the core [...]
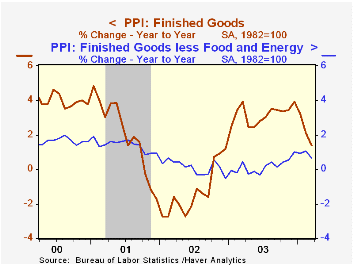
Finished producer prices jumped 0.5% higher last month following a 0.1% February uptick. The surge matched consensus expectations. The core PPI also rose a moderate 0.2% following the 0.1% February rise. A 0.1% increase in the core PPI had been the Consensus expectation.
Finished food prices jumped 1.5% (5.3% y/y) in March. Pricing strength during the last year has been broad based. Energy prices rose 0.6% (-0.4% y/y)
Finished consumer goods prices surged 0.7% after the tame 0.1% increase in February. Less food & energy finished consumer goods prices rose 0.3% (0.6% y/y following no change in February. Consumer durable prices rose 0.6% (+0.4% y/y) after a 0.2% February drop. Core non-durable prices fell 0.1% (+0.7% y/y) after 0.2% increases in the prior two months.
Finished capital goods prices rose 0.3% (0.8% y/y) after no change in February. That gain was fueled by a 0.8% (-1.6% y/y) recovery in light truck prices after a 1.9% February drop.
Intermediate goods prices again were strong, rising 0.7%. Core intermediate prices climbed 0.6% (2.9% y/y) led by an 8.6% jump in plywood prices (49.1% y/y) after a 15.2% spike in February.
Crude goods prices were tame as crude energy prices fell 6.1% (-26.5% y/y) after no change in February. Lower natural gas prices (-40.3% y/y) account for recent weakness. Prices for core crude goods jumped 2.7% as metals prices continued to spike higher.
"Decomposing Inflation" from the Federal Reserve Bank of Atlanta can be found here.
| Producer Price Index | Mar | Feb | Y/Y | 2003 | 2002 | 2001 |
|---|---|---|---|---|---|---|
| Finished Goods | 0.5% | 0.1% | 1.4% | 3.2% | -1.3% | 2.0% |
| Core | 0.2% | 0.1% | 0.7% | 0.2% | 0.1% | 1.4% |
| Intermediate Goods | 0.7% | 0.9% | 1.3% | 4.7% | -1.5% | 0.4% |
| Core | 0.6% | 0.9% | 2.9% | 2.0% | -0.5% | -0.1% |
| Crude Goods | 0.7% | 2.5% | -1.6% | 25.0% | -10.6% | 0.3% |
| Core | 2.7% | 5.5% | 29.8% | 12.3% | 3.8% | -10.0% |
by Tom Moeller April 22, 2004
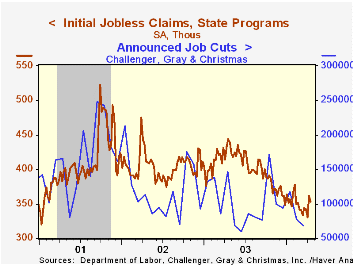
Initial claims for jobless insurance fell 9,000 last week to 353,000 but fell short of Consensus expectations for a decline to 345,000 claims. Claims during the prior week were revised up slightly.
The 4-week moving average of initial claims rose to 347,000 (-19.5% y/y), the highest level since late February.
Continuing claims for unemployment insurance jumped 52,000 in the latest week but claims so far in April remained 1.5% below the March average.
The insured rate of unemployment was unchanged at 2.4% for the seventh consecutive week. This unemployment rate averaged 2.8% during 2002 and 2003.
| Unemployment Insurance (000s) | 4/17/04 | 4/10/04 | Y/Y | 2003 | 2002 | 2001 |
|---|---|---|---|---|---|---|
| Initial Claims | 353 | 362 | -20.5% | 403 | 404 | 406 |
| Continuing Claims | -- | 3,019 | -15.3% | 3,533 | 3,573 | 3,023 |

Tom Moeller
AuthorMore in Author Profile »Prior to joining Haver Analytics in 2000, Mr. Moeller worked as the Economist at Chancellor Capital Management from 1985 to 1999. There, he developed comprehensive economic forecasts and interpreted economic data for equity and fixed income portfolio managers. Also at Chancellor, Mr. Moeller worked as an equity analyst and was responsible for researching and rating companies in the economically sensitive automobile and housing industries for investment in Chancellor’s equity portfolio. Prior to joining Chancellor, Mr. Moeller was an Economist at Citibank from 1979 to 1984. He also analyzed pricing behavior in the metals industry for the Council on Wage and Price Stability in Washington, D.C. In 1999, Mr. Moeller received the award for most accurate forecast from the Forecasters' Club of New York. From 1990 to 1992 he was President of the New York Association for Business Economists. Mr. Moeller earned an M.B.A. in Finance from Fordham University, where he graduated in 1987. He holds a Bachelor of Arts in Economics from George Washington University.
More Economy in Brief


