 Global| Dec 10 2004
PPI Boosted by Energy & Food, Core As Expected
by:Tom Moeller
|in:Economy in Brief
Summary
In November, the PPI for finished goods rose 0.5% and again outpaced the Consensus forecast for a 0.2% gain. Less food & energy, a 0.2% rise in "core" prices was as expected. Finished energy prices added 1.8% (19.9% y/y) to the 6.8% [...]
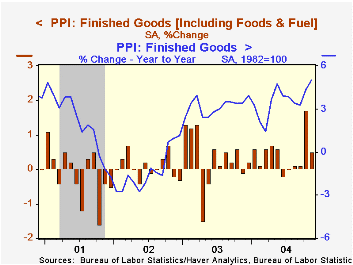
In November, the PPI for finished goods rose 0.5% and again outpaced the Consensus forecast for a 0.2% gain. Less food & energy, a 0.2% rise in "core" prices was as expected.
Finished energy prices added 1.8% (19.9% y/y) to the 6.8% spike in October. Residential natural gas prices jumped 8.2% (16.5% y/y), offsetting a 6.0% (47.4% y/y) decline in gasoline prices and a 6.3% (63.0% y/y) fall in fuel oil prices.
Finished food prices increased 0.4% (3.1% y/y) on top of the 1.6% October gain. Fish prices posted a notable gain (18.3% y/y) that offset scattered declines in several other categories..
The 0.2% increase in core finished consumer goods prices reflected a 0.3% (1.8% y/y) rise in durable goods prices that followed two months of 0.4% gain. Core consumer nondurable prices rose 0.2% (1.9% y/y) for the second consecutive month. Finished capital goods prices also rose 0.2% (2.1% y/y) after two months of 0.4% gain.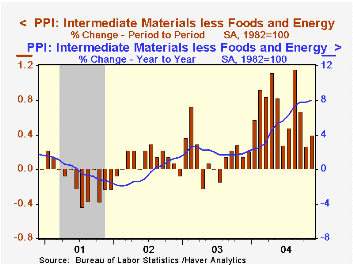
Intermediate goods prices were strong again and rose 0.8%, powered last month by a 10.9% (23.8%) rise in natural gas prices paid by public utilities. Core intermediate prices also showed some firmness and rose 0.4%.
Crude prices jumped another 8.7%, doubling October's 4.3% gain. Core crude prices also rose strong 2.5% but the rate of gain halved versus October. Iron & steel scrap prices rose again (+84.0% y/y as did prices for copper scrap (36.8% y/y) and aluminum scrap (+12.9 y/y. During the last thirty years "core" crude prices have been a fair indicator of industrial sector activity with a 51% correlation between the six month change in core crude prices and the change in factory sector industrial production.
"The Historical and Recent Behavior of Goods and Services Inflation" from the Federal Reserve Bank of New York can be found here.
| Producer Price Index | Nov | Oct | Y/Y | 2003 | 2002 | 2001 |
|---|---|---|---|---|---|---|
| Finished Goods | 0.5% | 1.7% | 5.1% | 3.2% | -1.3% | 2.0% |
| Core | 0.2% | -0.3% | 1.9% | 0.2% | 0.1% | 1.4% |
| Intermediate Goods | 0.8% | 0.9% | 9.7% | 4.7% | -1.5% | 0.4% |
| Core | 0.4% | 0.3% | 8.0% | 2.0% | -0.5% | -0.1% |
| Crude Goods | 8.7% | 4.3% | 25.9% | 25.1% | -10.6% | 0.3% |
| Core | 2.5% | 5.4% | 26.1% | 12.4% | 3.8% | -10.0% |

Tom Moeller
AuthorMore in Author Profile »Prior to joining Haver Analytics in 2000, Mr. Moeller worked as the Economist at Chancellor Capital Management from 1985 to 1999. There, he developed comprehensive economic forecasts and interpreted economic data for equity and fixed income portfolio managers. Also at Chancellor, Mr. Moeller worked as an equity analyst and was responsible for researching and rating companies in the economically sensitive automobile and housing industries for investment in Chancellor’s equity portfolio. Prior to joining Chancellor, Mr. Moeller was an Economist at Citibank from 1979 to 1984. He also analyzed pricing behavior in the metals industry for the Council on Wage and Price Stability in Washington, D.C. In 1999, Mr. Moeller received the award for most accurate forecast from the Forecasters' Club of New York. From 1990 to 1992 he was President of the New York Association for Business Economists. Mr. Moeller earned an M.B.A. in Finance from Fordham University, where he graduated in 1987. He holds a Bachelor of Arts in Economics from George Washington University.
More Economy in Brief


