 Global| Sep 18 2008
Philadelphia Fed Index Rose to Its Highest Since Last Year
by:Tom Moeller
|in:Economy in Brief
Summary
The Philadelphia Federal Reserve Bank indicated that its September Index of General Business conditions in the manufacturing sector improved sharply. The index reading of 3.8 was up from a revised -12.7 in August and it was the [...]

The Philadelphia Federal Reserve Bank indicated that its September Index of General Business conditions in the manufacturing sector improved sharply. The index reading of 3.8 was up from a revised -12.7 in August and it was the highest level since November of last year. A reading of -10 had been expected for this month.
The Philadelphia Fed constructs a diffusion index for total business activity and each of the sub-indexes. The business conditions index reflects a separate survey question.
During the last ten years there has been a 61% correlation between the level of the Philadelphia Fed Business Conditions Index and the three-month growth in factory sector industrial production. There has been a 43% correlation with q/q growth in real GDP.
The new orders index led this month's improvement with a sharp rise to 5.8, its first positive reading since December. The shipments index also improved, but more moderately, to its highest level since December. 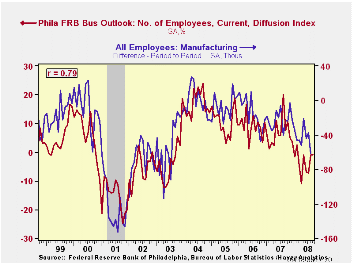
The employment index, at -0.9, held roughly steady with August as 18.2% of respondents expected to increase employment levels while 19.2% expected to decrease them. During the last ten years there has been a 79% correlation between the index level and the m/m change in manufacturing sector payrolls.
The prices paid index fell sharply. The decline to 31.5 brought it to the lowest level in twelve months. During the last ten years there has been a 67% correlation between the prices paid index and the three-month growth in the intermediate goods PPI. There has been an 82% correlation with the change in core intermediate goods prices.
The separate index of expected business conditions in six months improved moderately to the highest level since October of last year. Expectations for new orders and for shipments rose while expectations for employment slipped. The prices fell to its lowest level in over one year.
The latest Business Outlook Survey from the Federal Reserve Bank of Philadelphia can be found here.
| Philadelphia Fed (%) | September | August | September '07 | 2007 | 2006 | 2005 |
|---|---|---|---|---|---|---|
| General Activity Index | 3.8 | -12.7 | 9.2 | 5.1 | 8.1 | 11.5 |
| Prices Paid Index | 31.5 | 57.5 | 23.8 | 26.4 | 36.6 | 40.1 |

Tom Moeller
AuthorMore in Author Profile »Prior to joining Haver Analytics in 2000, Mr. Moeller worked as the Economist at Chancellor Capital Management from 1985 to 1999. There, he developed comprehensive economic forecasts and interpreted economic data for equity and fixed income portfolio managers. Also at Chancellor, Mr. Moeller worked as an equity analyst and was responsible for researching and rating companies in the economically sensitive automobile and housing industries for investment in Chancellor’s equity portfolio. Prior to joining Chancellor, Mr. Moeller was an Economist at Citibank from 1979 to 1984. He also analyzed pricing behavior in the metals industry for the Council on Wage and Price Stability in Washington, D.C. In 1999, Mr. Moeller received the award for most accurate forecast from the Forecasters' Club of New York. From 1990 to 1992 he was President of the New York Association for Business Economists. Mr. Moeller earned an M.B.A. in Finance from Fordham University, where he graduated in 1987. He holds a Bachelor of Arts in Economics from George Washington University.
More Economy in Brief


