 Global| Sep 16 2004
Philadelphia Fed Activity Index Down, Components Up
by:Tom Moeller
|in:Economy in Brief
Summary
The Philadelphia Feds September index of general business conditions in the manufacturing sector fell much more than expected to 13.4, the lowest in nearly a year. The level, however, still suggested positive growth. The 15.1 point [...]
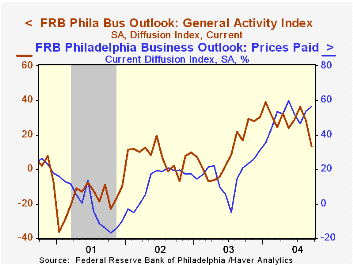
The Philadelphia Fed’s September index of general business conditions in the manufacturing sector fell much more than expected to 13.4, the lowest in nearly a year. The level, however, still suggested positive growth. The 15.1 point drop versus August followed a 7.6 point July decline and was versus Consensus expectations for a decline to 25.0.
During the last ten years there has been a 71% correlation between the level of the Philadelphia Fed Business Conditions Index and three month growth in factory sector industrial production. There has been a 53% correlation with q/q growth in real GDP.
Virtually all of the sub indexes improved m/m especially new orders, unfilled orders, delivery times, inventories, the number of employees and the average workweek. Shipments fell.
The business conditions index reflects a separate survey question, not the sub indexes.
The separate index of expected business conditions in six months fell sharply and lost about half of the 16.4 point improvement in August.
The prices paid index rose to the second highest level of the year. During the last ten years there has been a 75% correlation between the prices paid index and the three month growth in the PPI for intermediate goods. The correlation with the finished goods PPI has been 41% and with the CPI it's been 45%.
The Philadelphia Fed index is based on a survey of 250 regional manufacturing firms, but these firms sell nationally and internationally.
The latest Business Outlook survey from the Philadelphia Federal Reserve Bank can be found here.
| Philadelphia Fed Business Outlook | Sept | Aug | Sept '03 | 2003 | 2002 | 2001 |
|---|---|---|---|---|---|---|
| General Activity Index | 13.4 | 28.5 | 16.5 | 10.6 | 7.7 | -17.2 |
| Prices Paid Index | 56.4 | 53.7 | 21.0 | 16.7 | 12.2 | -0.9 |

Tom Moeller
AuthorMore in Author Profile »Prior to joining Haver Analytics in 2000, Mr. Moeller worked as the Economist at Chancellor Capital Management from 1985 to 1999. There, he developed comprehensive economic forecasts and interpreted economic data for equity and fixed income portfolio managers. Also at Chancellor, Mr. Moeller worked as an equity analyst and was responsible for researching and rating companies in the economically sensitive automobile and housing industries for investment in Chancellor’s equity portfolio. Prior to joining Chancellor, Mr. Moeller was an Economist at Citibank from 1979 to 1984. He also analyzed pricing behavior in the metals industry for the Council on Wage and Price Stability in Washington, D.C. In 1999, Mr. Moeller received the award for most accurate forecast from the Forecasters' Club of New York. From 1990 to 1992 he was President of the New York Association for Business Economists. Mr. Moeller earned an M.B.A. in Finance from Fordham University, where he graduated in 1987. He holds a Bachelor of Arts in Economics from George Washington University.
More Economy in Brief


