 Global| Jul 12 2004
OECD Leaders Wobble
by:Tom Moeller
|in:Economy in Brief
Summary
Growth in the Index of Leading Indicators for the Major Seven OECD Countries slumped through May. The 4.4% rate of growth was the weakest since last July and reflected declines in the index level during two of the last three months. [...]
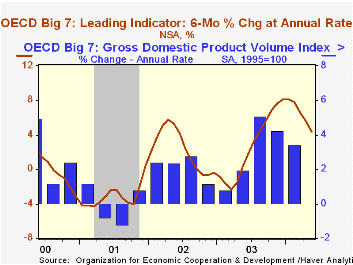
Growth in the Index of Leading Indicators for the Major Seven OECD Countries slumped through May. The 4.4% rate of growth was the weakest since last July and reflected declines in the index level during two of the last three months. Benchmark revisions lowered the country index levels but growth rates through 2003 were generally raised.
Leaders in Japan fell in each of the last three months and are down 1.3% from the February high. The six-month growth rate went negative for the first time in about a year. Weakness in construction and an excess of imports over exports accounts for much of the decline.
The leading index for the European Union has continued to rise, up 0.2% in each of the last two months but the six month growth rate eased to 4.7% versus the high of 6.2% late last year.
In France the leading index jumped 0.6% in May leaving the six-month growth rate at 6.4%. Leaders in Germany rose 0.3% in four of the five months this year, though these figures are slightly lower than initially reported. The six-month growth rate of 6.1% is off its December high of 9.0%.
Leaders in the UK fell 0.3% for the second month in the last three. The six month growth rate dropped to fell to 2.0% from the high of 5.1% in February. In Italy the leaders fell for the second consecutive month in May and that pulled six month growth to 0.4% its lowest in a year.
In Canada the leading index has been on a tear, up 1.0% in May following an upwardly revised 0.7% gain in April. The six-month growth rate rose to 8.4%, its highest in two years. In the United States the leading indicators slipped 0.1% for the second month in the last three. The six-month growth rate fell to 6.5% from its December high of 12.2%.
Visit the OECD's website at this website.
| OECD Main Economic Indicators | May | April | 6-Mth Chg. | 2003 | 2002 | 2001 |
|---|---|---|---|---|---|---|
| OECD Major Seven - Leading Index (Trend Restored) |
102.5 | 102.6 | 4.4% | 2.6% | 2.3% | -3.1% |
| European Union | 105.9 | 105.7 | 4.7% | 2.4% | 3.5% | -2.5% |
| Japan | 96.5 | 97.0 | -0.5% | 1.7% | 0.2% | -4.6% |
| United States | 103.3 | 103.5 | 6.5% | 3.9% | 2.1% | -3.2% |

Tom Moeller
AuthorMore in Author Profile »Prior to joining Haver Analytics in 2000, Mr. Moeller worked as the Economist at Chancellor Capital Management from 1985 to 1999. There, he developed comprehensive economic forecasts and interpreted economic data for equity and fixed income portfolio managers. Also at Chancellor, Mr. Moeller worked as an equity analyst and was responsible for researching and rating companies in the economically sensitive automobile and housing industries for investment in Chancellor’s equity portfolio. Prior to joining Chancellor, Mr. Moeller was an Economist at Citibank from 1979 to 1984. He also analyzed pricing behavior in the metals industry for the Council on Wage and Price Stability in Washington, D.C. In 1999, Mr. Moeller received the award for most accurate forecast from the Forecasters' Club of New York. From 1990 to 1992 he was President of the New York Association for Business Economists. Mr. Moeller earned an M.B.A. in Finance from Fordham University, where he graduated in 1987. He holds a Bachelor of Arts in Economics from George Washington University.
More Economy in Brief


