 Global| Dec 13 2006
Mortgage Applications Rose Further
by:Tom Moeller
|in:Economy in Brief
Summary
The total number of mortgage applications rose 11.4% last week after an 8.1% rise during the prior period, according to the Mortgage Bankers Association. Purchase applications continued firm and posted an 8.7% jump after the 4.9% rise [...]
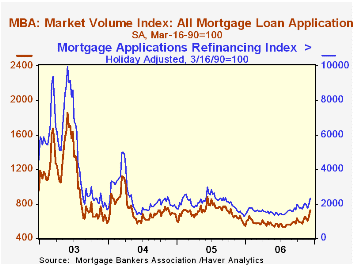
The total number of mortgage applications rose 11.4% last week after an 8.1% rise during the prior period, according to the Mortgage Bankers Association.
Purchase applications continued firm and posted an 8.7% jump after the 4.9% rise during the prior week. The increases lifted purchase applications in December 9.7% above the November average which rose 6.4% from the October level.
During the last ten years there has been a 58% correlation between the y/y change in purchase applications and the change in new plus existing single family home sales.
Applications to refinance logged another double digit increase and jumped 15.8% on the heels of the prior week's 13.7% spike.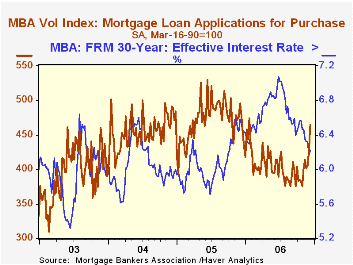
The effective interest rate on a conventional 30-year mortgage increased slightly w/w to 6.22% but the average of 6.19% so far in December is down versus 6.36% during November. The peak for 30 year financing was 7.08% late in June. Rates for 15-year financing also increased to 6.00% and averaged 6.13% last month. Interest rates on 15 and 30 year mortgages are closely correlated (>90%) with the rate on 10 year Treasury securities.
During the last ten years there has been a (negative) 79% correlation between the level of applications for purchase and the effective interest rate on a 30-year mortgage.
The Mortgage Bankers Association surveys between 20 to 35 of the top lenders in the U.S. housing industry to derive its refinance, purchase and market indexes. The weekly survey covers roughly 50% of all U.S. residential mortgage applications processed each week by mortgage banks, commercial banks and thrifts. Visit the Mortgage Bankers Association site here.
| MBA Mortgage Applications (3/16/90=100) | 12/08/06 | 12/01/06 | Y/Y | 2005 | 2004 | 2003 |
|---|---|---|---|---|---|---|
| Total Market Index | 721.2 | 647.6 | 16.5% | 708.6 | 735.1 | 1,067.9 |
| Purchase | 463.8 | 426.6 | -3.0% | 470.9 | 454.5 | 395.1 |
| Refinancing | 2,304.4 | 1,989.7 | 59.8% | 2,092.3 | 2,366.8 | 4,981.8 |

Tom Moeller
AuthorMore in Author Profile »Prior to joining Haver Analytics in 2000, Mr. Moeller worked as the Economist at Chancellor Capital Management from 1985 to 1999. There, he developed comprehensive economic forecasts and interpreted economic data for equity and fixed income portfolio managers. Also at Chancellor, Mr. Moeller worked as an equity analyst and was responsible for researching and rating companies in the economically sensitive automobile and housing industries for investment in Chancellor’s equity portfolio. Prior to joining Chancellor, Mr. Moeller was an Economist at Citibank from 1979 to 1984. He also analyzed pricing behavior in the metals industry for the Council on Wage and Price Stability in Washington, D.C. In 1999, Mr. Moeller received the award for most accurate forecast from the Forecasters' Club of New York. From 1990 to 1992 he was President of the New York Association for Business Economists. Mr. Moeller earned an M.B.A. in Finance from Fordham University, where he graduated in 1987. He holds a Bachelor of Arts in Economics from George Washington University.
More Economy in Brief


