 Global| Mar 31 2004
Mortgage Applications Eased As Rates Ticked Up
by:Tom Moeller
|in:Economy in Brief
Summary
The index of mortgage applications compiled by the Mortgage Bankers Association eased another 2.1% last week. That followed a 0.2% dip the prior period. Despite these recent backpedals, mortgage applications are up 25.1% in March [...]
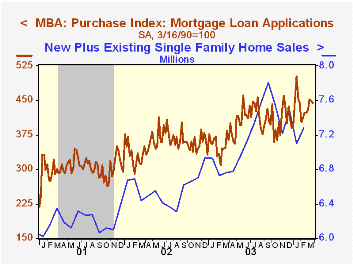
The index of mortgage applications compiled by the Mortgage Bankers Association eased another 2.1% last week. That followed a 0.2% dip the prior period. Despite these recent backpedals, mortgage applications are up 25.1% in March versus February.
The effective interest rate on a conventional 30-Year mortgage rose to 5.75% from 5.62% during the prior two weeks. The effective rate on a 15-year mortgage rose to 5.08%.
Purchase applications fell 1.1% w/w (+21.7% y/y) for the second weekly decline. March purchase applications are 6.7% ahead of the February average.
During the last ten years there has been a 56% correlation between the y/y change in purchase applications and the change in new plus existing home sales.
Applications to refinance fell 2.6% (-25.1% y/y) following six weeks of gain.
The Mortgage Bankers Association surveys between 20 to 35 of the top lenders in the U.S. housing industry to derive its refinance, purchase and market indexes. The weekly survey accounts for more than 40% of all applications processed each week by mortgage lenders. Visit the Mortgage Bankers Association site here.
| MBA Mortgage Applications (3/16/90=100) | 03/26/04 | 03/19/04 | 2003 | 2002 | 2001 |
|---|---|---|---|---|---|
| Total Market Index | 1,091.3 | 1,114.9 | 1,067.9 | 799.7 | 625.6 |
| Purchase | 443.8 | 449.9 | 395.1 | 354.7 | 304.9 |
| Refinancing | 4,857.6 | 4,988.7 | 4,981.8 | 3,388.0 | 2,491.0 |
by Tom Moeller March 31, 2004
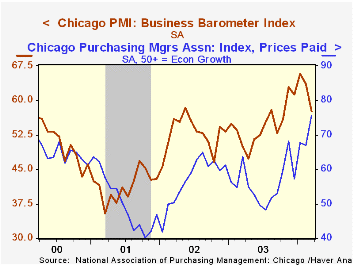
The Chicago Purchasing Managers Business Barometer for March fell to 57.6 from 63.6 in February. A lesser decline to 61.0 had been the Consensus expectation.
During the last twenty years there has been a 75% correlation between the level of the Chicago Business Barometer and quarterly growth in factory sector industrial output. There has been a 49% correlation with quarterly growth in real GDP.
The new orders index fell sharply to 60.4, the lowest level since September, and production fell to 59.1, also the lowest level since September. Still, the 1Q averages for orders and production are up versus 4Q03.
Employment fell to 49.2 but the 1Q average is up versus 4Q. During the last twenty years there has been a 71% correlation between the level of the employment index and the y/y change in factory sector payroll employment.
The index of prices paid jumped to 75.7, the highest level since May 1995.
| Chicago Purchasing Managers Index, SA | Mar '04 | Feb '04 | Mar '03 | 2003 | 2002 | 2001 |
|---|---|---|---|---|---|---|
| Business Barometer | 57.6 | 63.6 | 49.9 | 54.7 | 52.7 | 41.4 |
| New Orders | 60.4 | 67.5 | 53.9 | 58.0 | 56.2 | 42.3 |
| Prices Paid | 75.7 | 66.9 | 63.7 | 55.8 | 56.9 | 50.4 |
by Tom Moeller March 31, 2004
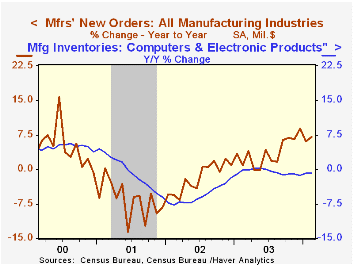
Factory orders rose 0.3% m/m in February but the gain was dominated by a surge in aircraft. Orders for commercial aircraft jumped 33.8% (29.8% y/y) and defense aircraft orders ballooned 61.4% (30.3% y/y). Excluding the transportation sector altogether orders fell 1.2% (7.4% y/y) following several months of strong gain.
Non-durable goods orders which equal shipments fell 2.0% (+4.9% y/y) due to declines in virtually all industries. The advance report of a 2.5% rise in orders for durable goods was unrevised.
Factory inventories rose 0.5% in February and that was the strongest monthly gain since January 2001. The swing to inventory accumulation from decumulation has been scattered across industries with the notable exceptions of the information technology and furniture industries.
Factory shipments fell 0.5% but the January gain was revised away.
| Factory Survey (NAICS) | Feb | Jan | Y/Y | 2003 | 2002 | 2001 |
|---|---|---|---|---|---|---|
| Inventories | 0.5% | 0.3% | -0.8% | -1.3% | -1.8% | -6.1% |
| New Orders | 0.3% | -0.9% | 7.0% | 3.7% | -1.9% | -6.7% |
| Shipments | -0.5% | -0.0% | 6.5% | 2.6% | -2.0% | -5.4% |
| Unfilled Orders | 0.6% | -0.0% | 5.0% | 4.2% | -6.1% | -5.9% |

Tom Moeller
AuthorMore in Author Profile »Prior to joining Haver Analytics in 2000, Mr. Moeller worked as the Economist at Chancellor Capital Management from 1985 to 1999. There, he developed comprehensive economic forecasts and interpreted economic data for equity and fixed income portfolio managers. Also at Chancellor, Mr. Moeller worked as an equity analyst and was responsible for researching and rating companies in the economically sensitive automobile and housing industries for investment in Chancellor’s equity portfolio. Prior to joining Chancellor, Mr. Moeller was an Economist at Citibank from 1979 to 1984. He also analyzed pricing behavior in the metals industry for the Council on Wage and Price Stability in Washington, D.C. In 1999, Mr. Moeller received the award for most accurate forecast from the Forecasters' Club of New York. From 1990 to 1992 he was President of the New York Association for Business Economists. Mr. Moeller earned an M.B.A. in Finance from Fordham University, where he graduated in 1987. He holds a Bachelor of Arts in Economics from George Washington University.
More Economy in Brief


