 Global| Jan 24 2008
Mass Layoffs Higher Still
by:Tom Moeller
|in:Economy in Brief
Summary
During December the number of mass layoff events rose another 7.8%, according to BLS data, and that countered a 1.3% November decline.These specific layoff incidents are called "mass layoffs" because they involve 50 or more initial [...]
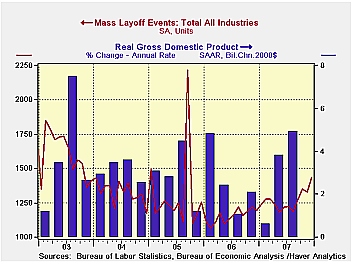
During December the number of mass layoff events rose another 7.8%, according to BLS data, and that countered a 1.3% November decline.These specific layoff incidents are called "mass layoffs" because they involve 50 or more initial claims for unemployment insurance.
The December gain left the number of mass layoff events, up 20% since December '06, at the highest level since January of 2005. For all of last year, mass layoff events rose 10.1% from 2006, reversing all of that year's 11.7% decline.
The December increase was accompanied by a 1.5% m/m gain in
initial claims for unemployment insurance. Versus December of 2006
claims rose 8.2% versus the prior December. For the full year the
number of claims rose 6.7%. That offset about half of the 2006 decline.
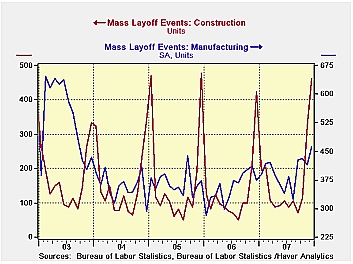
For all of last year the rise in mass layoff events was led by a 26.3% jump in the construction industry which offset all of 21.7% decline during 2006. Events in the factory sector rose 8.5% after an 11.5% '06 decline as layoffs in transportation industries rose 15.5%, 22.7% in furniture and 22.3% in primary metals.
Mass layoff events amongst industries in the service sector were scattered with a 64.5% rise in finance & insurance, a 5.8% gain retail trade and a 19.3% advance in the professional scientific & technical businesses. In the government sector mass layoff events rose but only by 2.5%. That offset just a piece of an 18.5% decline during 2006. In the arts & entertainment industries events fell 2.0% which followed a 16.4% decline during the prior year.
These mass layoff data are contained in Haver's flagship database, USECON. Data are also available by Census regions, divisions and states, including some industry detail for each. These are all carried in the REGIONAL database.
How Useful is Okun's Law? which examines the relationship between GDP growth and unemployment, from the Federal Reserve Bank of Kansas City, can be found here.
| Mass Layoffs, SA | December | November | December ‘06 | Monthly Averages | ||
|---|---|---|---|---|---|---|
| 2007 | 2006 | 2005 | ||||
| Number of Events | 1,433 | 1,329 | 1,1940 | 1,269 | 1,152 | 1,305 |
| Initial Claims (Number Persons) |
127,897 | 118,414 | 123,558 | 129,808 | 121,609 | 143,402 |

Tom Moeller
AuthorMore in Author Profile »Prior to joining Haver Analytics in 2000, Mr. Moeller worked as the Economist at Chancellor Capital Management from 1985 to 1999. There, he developed comprehensive economic forecasts and interpreted economic data for equity and fixed income portfolio managers. Also at Chancellor, Mr. Moeller worked as an equity analyst and was responsible for researching and rating companies in the economically sensitive automobile and housing industries for investment in Chancellor’s equity portfolio. Prior to joining Chancellor, Mr. Moeller was an Economist at Citibank from 1979 to 1984. He also analyzed pricing behavior in the metals industry for the Council on Wage and Price Stability in Washington, D.C. In 1999, Mr. Moeller received the award for most accurate forecast from the Forecasters' Club of New York. From 1990 to 1992 he was President of the New York Association for Business Economists. Mr. Moeller earned an M.B.A. in Finance from Fordham University, where he graduated in 1987. He holds a Bachelor of Arts in Economics from George Washington University.
More Economy in Brief


