 Global| Jul 17 2007
Lower Energy Prices Ease U.S. PPI; Core Prices Firm
by:Tom Moeller
|in:Economy in Brief
Summary
The producer price index for finished goods fell 0.2% last month following its 0.9% rise in May. The decline compared to Consensus forecasts for a 0.1% increase and it was the first decline since January. Food prices fell 0.8% (+6.3% [...]
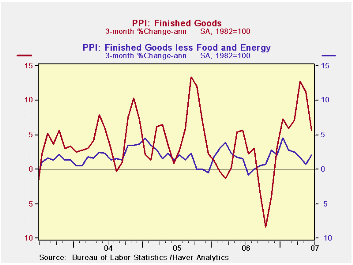
The producer price index for finished goods fell 0.2% last month following its 0.9% rise in May. The decline compared to Consensus forecasts for a 0.1% increase and it was the first decline since January.
Food prices fell 0.8% (+6.3% y/y) after May's 0.2% dip.
Energy prices, in addition, declined a sharp 1.1% (+4.3% y/y) as gasoline prices fell 3.9% (+3.8% y/y).Fuel oil dipped 0.5% (-0.6% y/y/y) but natural gas prices increased a hefty 2.6% (6.8% y/y), the firmest y/y increase since June 2006.
The core finished goods PPI increased 0.3%, bit more than the 0.2% May rise but the last two increases followed two months of unchanged readings during March and April. Consensus estimates were for a 0.2% increase in June.
Finished consumer goods prices less food & energy rose 0.3% (1.7% y/y) as passenger car prices rose 0.9% (-1.8% y/y) after an unchanged reading during May.
Capital equipment prices increased 0.2% (1.8% y/y) after unchanged prices during the prior two months. Most of the June increase was due to a 1.0% (0.8% y/y) in prices of light motor trucks.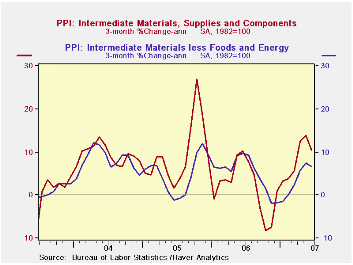
Intermediate goods prices added 0.5% to the firm 1.1% increase during May.Intermediate food prices rose a large 1.6% (15.3% y/y), suggesting future strength in finished food prices. The index excluding food & energy prices rose the same 0.4% (2.7% y/y) as it did during May.
The crude materials PPI rose 0.3% (14.9% y/y), as energy prices rose 0.6% (8.5% y/y) and food prices rose 0.5% (27.1% y/y). The core crude materials PPI fell 0.2% (10.2% y/y) as copper scrap prices fell 6.6% NSA (+9.6% y/y) and aluminum scrap prices fell 2.3% NSA (-3.3% y/y).
| Producer Price Index | June | May | Y/Y | 2006 | 2005 | 2004 |
|---|---|---|---|---|---|---|
| Finished Goods | -0.2 | 0.9% | 3.2% | 2.9% | 4.9% | 3.6% |
| Core | 0.3 | 0.2% | 1.8% | 1.4% | 2.4% | 1.5% |
| Intermediate Goods | 0.5% | 1.1% | 3.4% | 6.4% | 8.0% | 6.6% |
| Core | 0.4% | 0.4% | 2.7% | 6.0% | 5.5% | 5.7% |
| Crude Goods | 0.3% | 2.0% | 14.9% | 1.4% | 14.6% | 17.5% |
| Core | -0.2% | 0.1% | 10.1% | 20.9% | 4.9% | 26.5% |

Tom Moeller
AuthorMore in Author Profile »Prior to joining Haver Analytics in 2000, Mr. Moeller worked as the Economist at Chancellor Capital Management from 1985 to 1999. There, he developed comprehensive economic forecasts and interpreted economic data for equity and fixed income portfolio managers. Also at Chancellor, Mr. Moeller worked as an equity analyst and was responsible for researching and rating companies in the economically sensitive automobile and housing industries for investment in Chancellor’s equity portfolio. Prior to joining Chancellor, Mr. Moeller was an Economist at Citibank from 1979 to 1984. He also analyzed pricing behavior in the metals industry for the Council on Wage and Price Stability in Washington, D.C. In 1999, Mr. Moeller received the award for most accurate forecast from the Forecasters' Club of New York. From 1990 to 1992 he was President of the New York Association for Business Economists. Mr. Moeller earned an M.B.A. in Finance from Fordham University, where he graduated in 1987. He holds a Bachelor of Arts in Economics from George Washington University.
More Economy in Brief


