 Global| Jul 22 2004
Leading Indicators Fell
by:Tom Moeller
|in:Economy in Brief
Summary
The June Composite Index of Leading Economic Indicators reported by the Conference Board fell unexpectedly by 0.2%. A 0.4% increase had been expected. It was the first decline since March of last year. Though 55% of the component [...]
The June Composite Index of Leading Economic Indicators reported by the Conference Board fell unexpectedly by 0.2%. A 0.4% increase had been expected. It was the first decline since March of last year.
Though 55% of the component series rose last month, shorter weekly hours and lower building permits combined to subtract over 0.3 percentage points from the m/m change.
Over a six-month span 90% of the leaders' components have risen. During the last ten years there has been a 63% correlation between the six-month diffusion index of the leaders and quarterly growth in real GDP.
The leading index is based on eight previously reported economic data series and two that are estimated.
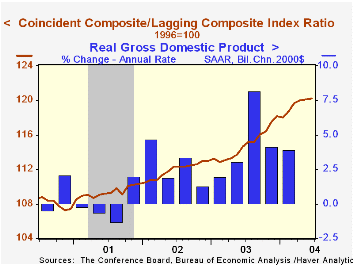
The coincident indicators ticked 0.1% higher, the gain held back by a decline in industrial production.
The ratio of coincident-to-lagging indicators rose slightly to another record level. The ratio is an indicator of excess relative to actual economic performance.
Visit the Conference Board's site for coverage of leading indicator series from around the world.
| Business Cycle Indicators | June | May | Y/Y | 2003 | 2002 | 2001 |
|---|---|---|---|---|---|---|
| Leading | -0.2% | 0.4% | 3.8% | 1.3% | 2.2% | -0.8% |
| Coincident | 0.1% | 0.3% | 2.8% | 0.4% | -0.5% | -0.5% |
| Lagging | 0.0% | 0.1% | -2.0% | -2.2% | -2.8% | -1.4% |
by Tom Moeller July 22, 2004
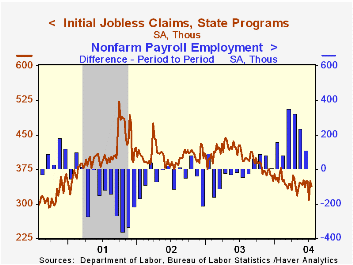
Initial claims for jobless insurance fell an expected 11,000 last week to 339,000. The latest figure covers the July survey period for non-farm payrolls and claims were about even with the June period.
During the last ten years there has been a (negative) 75% correlation between the level of initial jobless claims and the m/m change in non-farm payrolls.
The 4-week moving average of initial claims fell to 336,750 (-18.8% y/y).
Continuing claims for unemployment insurance cratered 167,000 following a downwardly revised 105,000 gain the prior week.
The insured rate of unemployment fell to 2.2%, the lowest level since May 2001.
| Unemployment Insurance (000s) | 7/17/04 | 7/10/04 | Y/Y | 2003 | 2002 | 2001 |
|---|---|---|---|---|---|---|
| Initial Claims | 339 | 350 | -14.0% | 403 | 404 | 406 |
| Continuing Claims | -- | 2,797 | -21.4% | 3,533 | 3,573 | 3,023 |

Tom Moeller
AuthorMore in Author Profile »Prior to joining Haver Analytics in 2000, Mr. Moeller worked as the Economist at Chancellor Capital Management from 1985 to 1999. There, he developed comprehensive economic forecasts and interpreted economic data for equity and fixed income portfolio managers. Also at Chancellor, Mr. Moeller worked as an equity analyst and was responsible for researching and rating companies in the economically sensitive automobile and housing industries for investment in Chancellor’s equity portfolio. Prior to joining Chancellor, Mr. Moeller was an Economist at Citibank from 1979 to 1984. He also analyzed pricing behavior in the metals industry for the Council on Wage and Price Stability in Washington, D.C. In 1999, Mr. Moeller received the award for most accurate forecast from the Forecasters' Club of New York. From 1990 to 1992 he was President of the New York Association for Business Economists. Mr. Moeller earned an M.B.A. in Finance from Fordham University, where he graduated in 1987. He holds a Bachelor of Arts in Economics from George Washington University.
More Economy in Brief


