 Global| Apr 21 2005
Leading Indicators Down
by:Tom Moeller
|in:Economy in Brief
Summary
The Composite Index of Leading Economic Indicators reported by the Conference Board fell 0.4% in March, the second decline in three months. Six-month growth in the leaders fell further to -0.5%. Growth in the leaders deeper than -2.5% [...]
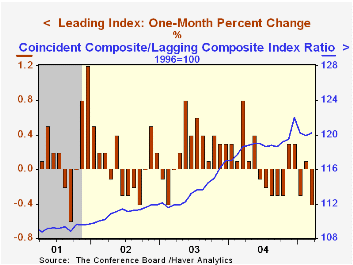
The Composite Index of Leading Economic Indicators reported by the Conference Board fell 0.4% in March, the second decline in three months. Six-month growth in the leaders fell further to -0.5%. Growth in the leaders deeper than -2.5% preceded past US recessions.
The breadth of one month gain amongst the 10 components of the leading index fell to a paltry 20% from a downwardly revised 40% in February. Higher claims for unemployment insurance had the largest negative effect pulling the leading index lower. Higher consumer goods orders and a steeper interest rate yield curve had the only positive influences.
The leading index is based on eight previously reported economic data series. Two series, orders for consumer goods and orders for capital goods, are estimated.
The coincident indicators rose 0.2% following a downwardly revised 0.1% gain in February. Six-month growth in the index was 3.1% and during the last ten years there has been an 84% correlation between six month growth in the coincident indicators and two quarter growth in real GDP.
The lagging indicators fell 0.1% due to a longer duration of unemployment and higher C&I loans.
The ratio of the coincident to the lagging indicators which measures actual economic performance relative to excess rose 0.3% (1.3% y/y) following a revised decline the prior month.
Visit the Conference Board's site for coverage of leading indicator series from around the world.
Chairman Alan Greenspan's testimony on Budget process reforms is available here.
| Business Cycle Indicators | Mar | Feb | 6-Month Chg | 2004 | 2003 | 2002 |
|---|---|---|---|---|---|---|
| Leading | -0.4% | 0.1% | -0.5% | 3.0% | 1.3% | 2.2% |
| Coincident | 0.2% | 0.1% | 3.1% | 2.6% | 0.4% | -0.5% |
| Lagging | -0.1% | 0.3% | 0.4% | -2.1% | -1.9% | -2.3% |

Tom Moeller
AuthorMore in Author Profile »Prior to joining Haver Analytics in 2000, Mr. Moeller worked as the Economist at Chancellor Capital Management from 1985 to 1999. There, he developed comprehensive economic forecasts and interpreted economic data for equity and fixed income portfolio managers. Also at Chancellor, Mr. Moeller worked as an equity analyst and was responsible for researching and rating companies in the economically sensitive automobile and housing industries for investment in Chancellor’s equity portfolio. Prior to joining Chancellor, Mr. Moeller was an Economist at Citibank from 1979 to 1984. He also analyzed pricing behavior in the metals industry for the Council on Wage and Price Stability in Washington, D.C. In 1999, Mr. Moeller received the award for most accurate forecast from the Forecasters' Club of New York. From 1990 to 1992 he was President of the New York Association for Business Economists. Mr. Moeller earned an M.B.A. in Finance from Fordham University, where he graduated in 1987. He holds a Bachelor of Arts in Economics from George Washington University.
More Economy in Brief


