 Global| Feb 17 2005
Leading Indicators Backpedaled
by:Tom Moeller
|in:Economy in Brief
Summary
The Composite Index of Leading Economic Indicators fell 0.3% in January following two months of 0.3% gain, reported the Conference Board. The six-month growth rate for the leaders remained negative at -1.4%. Six month growth in the [...]
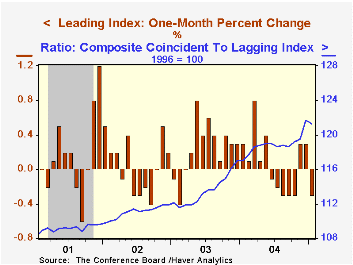
The Composite Index of Leading Economic Indicators fell 0.3% in January following two months of 0.3% gain, reported the Conference Board. The six-month growth rate for the leaders remained negative at -1.4%. Six month growth in the leaders deeper than -2.5% preceded past US recessions.
The breadth of one month gain amongst the 10 components of the leading index narrowed to 40% from 60% in December and 70% in November and the six month breadth of gain backpedaled to 50% from 70% the prior period. The largest negative contribution was made in January by lower vendor performance. Stock prices and the yield curve also were negative contributors.
The leading index is based on eight previously reported economic data series. Two series, orders for consumer goods and orders for capital goods, are estimated.
A longer leading indicator, the ratio of the coincident to the lagging indicators which measures actual economic performance relative to excess fell from the record high in December, the first decline since September.
The coincident indicators were unchanged following an upwardly revised 1.1% surge in December. The six-month growth rate dipped slightly to 3.6%. During the last ten years there has been an 84% correlation between the six month growth in the coincident indicators and two quarter growth in real GDP.
Visit the Conference Board's site for coverage of leading indicator series from around the world.
| Business Cycle Indicators | Jan | Dec | 6-Month Chg | 2004 | 2003 | 2002 |
|---|---|---|---|---|---|---|
| Leading | -0.3% | 0.3% | -1.4% | 3.0% | 1.3% | 2.2% |
| Coincident | 0.0% | 1.1% | 3.6% | 2.5% | 0.4% | -0.5% |
| Lagging | 0.3% | -0.7% | 0.8% | -2.1% | -1.9% | -2.3% |
by Tom Moeller February 17, 2005
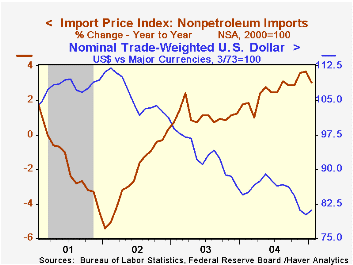
Import prices rose 0.9% last month due to a surprising 4.6% spurt in petroleum prices. Consensus expectations had been for a 0.6% rise. Nonpetroleum prices, however, rose an easier 0.2% following a downwardly revised gain of 0.4% in December.
During the last ten years there has been a negative 55% correlation between the foreign exchange value of the dollar against major currencies and the y/y change in nonpetroleum import prices. There has been a negative 39% correlation between the broad trade weighted dollar index and prices.
Import pricing strength in January was pronounced for consumer goods less autos, up 0.4% (0.8% y/y). Capital goods prices rose a moderate 0.2% (-0.8% y/y) but that gain was held back by a 1.0% (-6.9% y/y) decline in computer prices. Excluding computers capital goods prices rose 0.8% (2.3% y/y), lifted by a 1.7% rise in prices for civilian aircraft. Motor vehicle and parts prices fell 0.1% (+1.6% y/y) and food & beverage prices fell 0.2% (+6.9% y/y).
Petroleum prices jumped 4.6%. The price of Brent crude oil rose to $43.55 in January and is up roughly another dollar this month.
Export prices rose 0.7% due to a 0.7% surge (5.1% y/y) in nonagricultural export prices.
| Import/Export Prices (NSA) | Jan | Dec | Y/Y | 2004 | 2003 | 2002 |
|---|---|---|---|---|---|---|
| Import - All Commodities | 0.9% | -1.4% | 6.0% | 5.6% | 2.9% | -2.5% |
| Petroleum | 4.6% | -11.5% | 26.9% | 30.4% | 21.0% | 3.0% |
| Non-petroleum | 0.2% | 0.4% | 3.0% | 2.6% | 1.1% | -2.4% |
| Export - All Commodities | 0.7% | 0.2% | 4.0% | 3.9% | 1.6% | -1.0% |
by Tom Moeller February 17, 2005
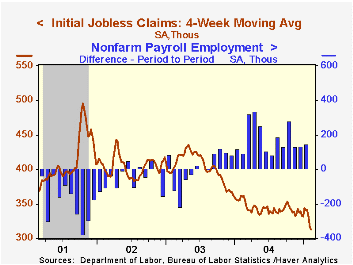
Initial claims for unemployment insurance inched down another 2,000 to 302,000 last week, the lowest level since late 2000. The prior week's figure was revised up slightly and Consensus expectations had been for 315,000 claims.
The latest figure covers the February survey period for nonfarm payrolls and initial claims were 16,000 (5.0%) lower than the prior month.
The four week moving average of initial claims fell to 311,750 (-13.5% y/y).
Continuing claims for unemployment insurance fell 14,000 following a downwardly revised gain of 40,000 the prior week.
During the last ten years there has been a (negative) 75% correlation between the level of initial claims for unemployment insurance and the monthly change in payroll employment. There has been a (negative) 66% correlation with the level of continuing claims.
The insured rate of unemployment fell to 2.1%, the lowest since 2001.
| Unemployment Insurance (000s) | 02/12/05 | 02/05/05 | Y/Y | 2004 | 2003 | 2002 |
|---|---|---|---|---|---|---|
| Initial Claims | 302 | 304 | -13.7% | 343 | 402 | 404 |
| Continuing Claims | -- | 2,717 | -15.9% | 2,926 | 3,531 | 3,570 |
by Tom Moeller February 17, 2005
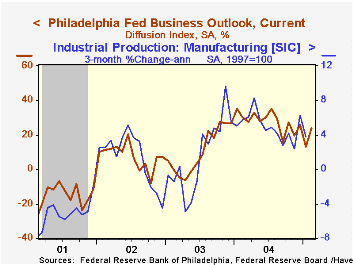
The Philadelphia Fed reported that its Index of General Business Conditions in the manufacturing sector improved in February to 23.9 from an unrevised 13.2 the prior month. Consensus expectations had been for a reading of 17.5.
During the last ten years there has been a 69% correlation between the level of the Philadelphia Fed Business Conditions Index and three month growth in factory sector industrial production. There has been a 52% correlation with q/q growth in real GDP.
Shipments recovered sharply but orders improved just modestly as the number of employees fell. During the last ten years there has been a 64% correlation between the employment index and the three month growth in factory payrolls.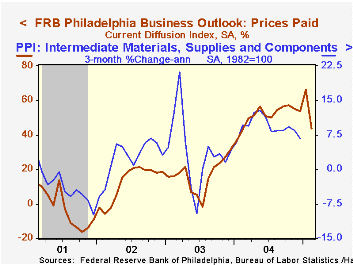
The business conditions index reflects a separate survey question, not the sub indexes.
The separate index of expected business conditions in six months also improved but just moderately.
The prices paid index fell to the lowest level in a year. During the last ten years there has been a 75% correlation between the prices paid index and the three month growth in the intermediate goods PPI. The correlation with the finished goods PPI has been 50% and with the CPI it's been 43%.
The Philadelphia Fed index is based on a survey of 250 regional manufacturing firms, but these firms sell nationally and internationally.
The latest Business Outlook survey from the Philadelphia Federal Reserve Bank can be found here.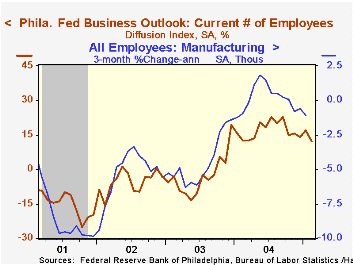
| Philadelphia Fed Business Outlook | Feb | Jan | Feb '04 | 2004 | 2003 | 2002 |
|---|---|---|---|---|---|---|
| General Activity Index | 23.9 | 13.2 | 30.1 | 28.1 | 10.6 | 7.7 |
| Prices Paid Index | 43.5 | 66.1 | 43.0 | 51.3 | 16.8 | 12.3 |

Tom Moeller
AuthorMore in Author Profile »Prior to joining Haver Analytics in 2000, Mr. Moeller worked as the Economist at Chancellor Capital Management from 1985 to 1999. There, he developed comprehensive economic forecasts and interpreted economic data for equity and fixed income portfolio managers. Also at Chancellor, Mr. Moeller worked as an equity analyst and was responsible for researching and rating companies in the economically sensitive automobile and housing industries for investment in Chancellor’s equity portfolio. Prior to joining Chancellor, Mr. Moeller was an Economist at Citibank from 1979 to 1984. He also analyzed pricing behavior in the metals industry for the Council on Wage and Price Stability in Washington, D.C. In 1999, Mr. Moeller received the award for most accurate forecast from the Forecasters' Club of New York. From 1990 to 1992 he was President of the New York Association for Business Economists. Mr. Moeller earned an M.B.A. in Finance from Fordham University, where he graduated in 1987. He holds a Bachelor of Arts in Economics from George Washington University.
More Economy in Brief


