 Global| Jul 20 2006
Leading Economic Indicators Nudged Higher
by:Tom Moeller
|in:Economy in Brief
Summary
The Conference Board reported that the composite index of leading economic indicators ticked up 0.1% in June, the first increase in three months, and followed an unrevised 0.6% decline the prior month. Consensus expectations had been [...]
The Conference Board reported that the composite index of leading economic indicators ticked up 0.1% in June, the first increase in three months, and followed an unrevised 0.6% decline the prior month. Consensus expectations had been for a 0.2% increase.
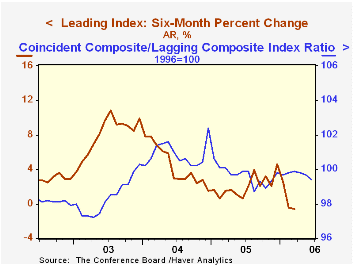
Six month growth in the leaders fell to -0.6%, its weakest since early 2001. During the last ten years there has been a 43% correlation between the six-month change in the leading indicators and quarterly growth in real GDP.
The breadth of one month gain amongst the 10 components of the leading index improved sharply to 65% in June but over a six month span only 50% of the index components rose, the weakest breadth of six month gain since early 2005. In June, positive contributions from the money supply, consumer expectations, hours worked & jobless claims were offset by lower stock prices, vendor performance and building permits .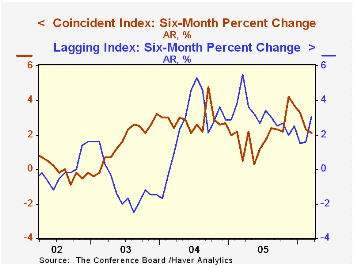
The method of calculating the contribution to the leading index from the spread between 10 year Treasury securities and the Fed funds rate has been revised. A negative contribution will now occur only when the spread inverts rather than when declining as in the past. More details can be found here.
The leading index is based on eight previously reported economic data series. Two series, orders for consumer goods and orders for capital goods, are estimated.
The coincident indicators rose 0.2% and during the last one & six months all of the coincident series rose. Over the last ten years there has been a 69% correlation between the change in the coincident indicators and real GDP growth.
The lagging indicators jumped 0.6%. During June nearly all of the series' components rose but during the last six months 42.9% rose. The ratio of coincident to lagging indicators, a measure of actual economic performance versus excess, fell for the third consecutive month.
Visit the Conference Board's site for coverage of leading indicator series from around the world.
| Business Cycle Indicators | June | May | 6 Month Chg., AR | 2005 | 2004 | 2003 |
|---|---|---|---|---|---|---|
| Leading | 0.1% | -0.6% | -0.6% | 2.3% | 7.4% | 5.0% |
| Coincident | 0.2% | 0.1% | 2.1% | 2.2% | 2.5% | 0.4% |
| Lagging | 0.6% | 0.2% | 3.1% | 3.5% | 0.0% | -0.0% |

Tom Moeller
AuthorMore in Author Profile »Prior to joining Haver Analytics in 2000, Mr. Moeller worked as the Economist at Chancellor Capital Management from 1985 to 1999. There, he developed comprehensive economic forecasts and interpreted economic data for equity and fixed income portfolio managers. Also at Chancellor, Mr. Moeller worked as an equity analyst and was responsible for researching and rating companies in the economically sensitive automobile and housing industries for investment in Chancellor’s equity portfolio. Prior to joining Chancellor, Mr. Moeller was an Economist at Citibank from 1979 to 1984. He also analyzed pricing behavior in the metals industry for the Council on Wage and Price Stability in Washington, D.C. In 1999, Mr. Moeller received the award for most accurate forecast from the Forecasters' Club of New York. From 1990 to 1992 he was President of the New York Association for Business Economists. Mr. Moeller earned an M.B.A. in Finance from Fordham University, where he graduated in 1987. He holds a Bachelor of Arts in Economics from George Washington University.
More Economy in Brief


