 Global| Jul 06 2007
June Payrolls Beat Forecasts. Prior Months Revised Up
by:Tom Moeller
|in:Economy in Brief
Summary
Nonfarm payrolls grew by 132,000 during June, an increase that slightly beat the Consensus forecast for a 125,000 rise. In addition, the prior two months' gains were upwardly revised by a collective 75,000. The unemployment rate held [...]
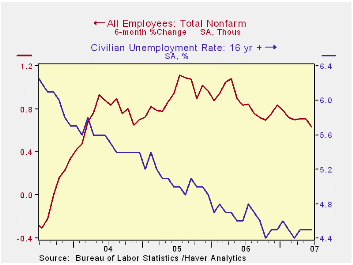
Nonfarm payrolls grew by 132,000 during June, an increase that slightly beat the Consensus forecast for a 125,000 rise. In addition, the prior two months' gains were upwardly revised by a collective 75,000.
The unemployment rate held steady last month at 4.5%. Household employment increased 197,000 (1.2%) following a 157,000 gain in May. The labor force jumped 310,000 (1.1% y/y), the largest gain this year. As a result, the labor force participation rate rose to 66.6%.
From the establishment survey, the job gain of 132,000 left the average gain in payrolls this year at 145,000 versus last year’s average of 189,000. Private service sector jobs rose just 95,000 (2.0% y/y), versus last year’s average gain of 154,000. Retail employment actually fell 24,200 (0.5% y/y) during June and the average this year has been a meager 7,000 per month after an outright decline of 2,000 per month during 2006. In the financial sector jobs grew just 1,000 (1.4% y/y) for an average 5,000 this year versus 16,000 last year. Professional & business services employment fell 9,000 and the average monthly gain this year has been 13,000, about a quarter of last year’s 42,000.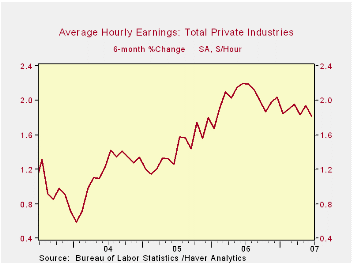
Factory sector payrolls fell again, by 18,000 (-1.3 y/y) but construction employment rose by 12,000 (-0.1% y/y). The average, though, during this year is a 1,000 per month decline versus an average 11,000 increase per month gain in 2006.
Government payrolls increased 40,000 (1.5% y/y) and in 2007 have risen an average 30,000, up from the per month average last year of 20,000.
Average hourly earnings increased 0.3% as factory sector earnings rose 0.2% (2.7% y/y and private service producing earnings rose a firm 0.4% (4.0% y/y). The monthly average increase in overall average hourly earnings this year has been 0.3% versus, down from 0.4% per month last year.
Inflation and Unemployment: A Layperson’s Guide to the Phillips Curve from the Federal Reserve Bank of Richmond is available here.
| Employment | June | May | Y/Y | 2006 | 2005 | 2004 |
|---|---|---|---|---|---|---|
| Payroll Employment | 132,000 | 190,000 | 1.5% | 1.9% | 1.7% | 1.1% |
| Manufacturing | -18,000 | -7,000 | -1.3% | -0.2% | -0.6% | -1.3% |
| Average Weekly Hours | 33.9 | 33.8 | 33.9 (June '06) | 33.8 | 33.8 | 33.7 |
| Average Hourly Earnings | 0.3% | 0.4% | 3.9% | 3.9% | 2.8% | 2.1% |
| Unemployment Rate | 4.5% | 4.5% | 4.6% (June '06) | 4.6% | 5.1% | 5.5% |

Tom Moeller
AuthorMore in Author Profile »Prior to joining Haver Analytics in 2000, Mr. Moeller worked as the Economist at Chancellor Capital Management from 1985 to 1999. There, he developed comprehensive economic forecasts and interpreted economic data for equity and fixed income portfolio managers. Also at Chancellor, Mr. Moeller worked as an equity analyst and was responsible for researching and rating companies in the economically sensitive automobile and housing industries for investment in Chancellor’s equity portfolio. Prior to joining Chancellor, Mr. Moeller was an Economist at Citibank from 1979 to 1984. He also analyzed pricing behavior in the metals industry for the Council on Wage and Price Stability in Washington, D.C. In 1999, Mr. Moeller received the award for most accurate forecast from the Forecasters' Club of New York. From 1990 to 1992 he was President of the New York Association for Business Economists. Mr. Moeller earned an M.B.A. in Finance from Fordham University, where he graduated in 1987. He holds a Bachelor of Arts in Economics from George Washington University.
More Economy in Brief


