 Global| Aug 09 2004
June Machinery Orders in Japan Point to Continued Expansion in the Economy
Summary
June machinery orders point to continued expansion in the Japanese economy. Machinery orders rose sharply in June. Foreign and public orders, taken together, were up 8.20% and core private orders, excluding ships and utilities were up [...]
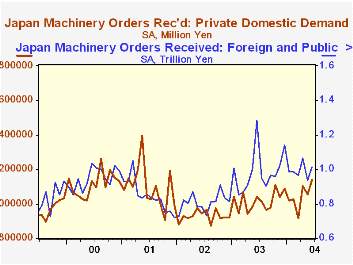
June machinery orders point to continued expansion in the Japanese economy. Machinery orders rose sharply in June. Foreign and public orders, taken together, were up 8.20% and core private orders, excluding ships and utilities were up 3.90%
Particularly encouraging was the 10.13% rise in private non-manufacturing orders. These orders had risen less than 7% in 2003 while manufacturing orders were up almost 18%. Manufacturing orders declined in June but the 12.4 billion yen decline was more than accounted for by the 33 billion yen drop in machinery orders of the iron and steel industry. Iron and steel orders were 11.2 billion yen in April, 43.0 in May and back down to 9.0billion yen in June.
| Machinery Orders (Billions of Yen) | Jun 04 | May 04 | Jun 03 | M/M % | Y/Y % | 2003 % | 2002 % | 2001 % |
|---|---|---|---|---|---|---|---|---|
| Foreign + Public | 1011.7 | 935.0 | 1284.3 | 8.2 | -21.26 | 22.22 | -4.64 | -10.68 |
| Private excl. ships & utilities |
1036.0 | 997.1 | 940.2 | 3.90 | 10.19 | 11.05 | -12.07 | -6.26 |
| Non-manufacturing | 604.1 | 548.5 | 562.7 | 10.13 | 7.36 | 6.74 | -11.51 | 2.01 |
| Manufacturing | 433.8 | 446.2 | 378.6 | -2.77 | 14.57 | 17.57 | -12.33 | -17.10 |
| Iron and Steel | 9.0 | 43.0 | 14.4 | -79.18 | -37.84 | 24.99 | -31.06 | 2.04 |
| Manufacturing excl. iron & steel | 424.8 | 403.2 | 364.2 | 5.35 | 16.64 | 17.27 | -11.47 | 1.86 |
by Louise Curley August 9, 2004
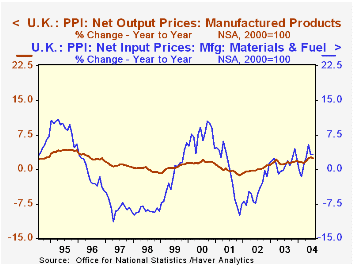
Last Thursday, August 5th, British monetary authorities raised the base rate by 25 basis points, the fifth such increase since last November, bringing the rate to 4.75%. The release today of the producer price indexes for input and output prices suggests that tightening by the monetary authorities may not be over.
While the index of total output prices rose only 0.10% from June to July the index of core output prices, i.e., prices of all items excluding food, beverages, tobacco and petroleum, rose 0.39% in July, the biggest monthly increase since January 1996. Moreover, trends in input prices suggest further upward pressure on output prices.
The index of input prices rose even more, 0.41%, than the index of core output prices in July. In addition, the July figure for input prices does not reflect the recent jump in oil prices that got underway in early August. Input prices, which tend to be much more volatile than output prices. do, in time, become reflected in output prices.
| UK Producer Prices (NSA) 2000 = 100 | Jul 04 | Jun 04 | Jul 03 | M/M % | Y/Y % | 2003 % | 2002 % | 2001% |
|---|---|---|---|---|---|---|---|---|
| Output Prices | 103.7 | 103.6 | 101.2 | 0.10 | 2.47 | 1.50 | 0.04 | -0.20 |
| "Core"* | 102.2 | 101.8 | 100.6 | 0.39 | 1.59 | 1.26 | -0.08 | -0.59 |
| Input Prices | 97.8 | 97.4 | 94.8 | 0.41 | 3.16 | 1.35 | -4.45 | -1.25 |
More Economy in Brief


