 Global| Jan 22 2004
Jobless Insurance Claims Dip
by:Tom Moeller
|in:Economy in Brief
Summary
Initial claims for jobless insurance edged 1,000 lower last week to 341,000. The prior week's level was revised down slightly. Consensus expectations had been for claims of 340,000. The latest claims figure covers the survey period [...]
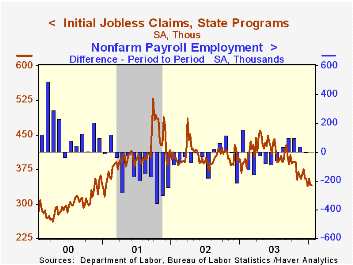
Initial claims for jobless insurance edged 1,000 lower last week to 341,000. The prior week's level was revised down slightly. Consensus expectations had been for claims of 340,000.
The latest claims figure covers the survey period for January non-farm payrolls. Claims were down 14,000 (3.9%) from the December survey period.
The four-week moving average of initial claims fell to 344,500 (-11.2% y/y).
Continuing claims for unemployment insurance rose 17,000 but the prior week's decline was revised deeper to 152,000.
The insured rate of unemployment was stable at 2.5%, the lowest level since September 2001.
| Unemployment Insurance (000s) | 01/17/04 | 01/10/04 | Y/Y | 2003 | 2002 | 2001 |
|---|---|---|---|---|---|---|
| Initial Claims | 341.0 | 342.0 | -12.1% | 403 | 404 | 406 |
| Continuing Claims | -- | 3,143 | -6.5% | 3,535 | 3,575 | 3,022 |
by Tom Moeller January 22, 2004
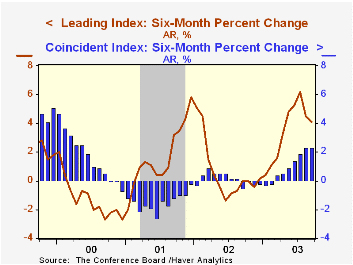
The Composite Index of Leading Economic Indicators reported by the Conference Board rose an expected 0.2% in December, the ninth consecutive monthly increase. November's gain was revised to 0.2% from 0.3%. Earlier months' data also were revised modestly.
One month gains amongst the leaders' component series surged to 75% and over a six-month span 90% of the series rose.
Improved vendor performance, higher stock prices and higher building permits had the largest positive contributions to the December gain in the leading index but a lower money supply had a meaningful negative contribution for the fourth consecutive month.
The Leading index is based on eight previously reported economic data series and two that are estimated.
The coincident indicators rose again with the gain driven by higher real manufacturing & trade sales and higher real income.
The ratio of coincident-to-lagging indicators was unchanged at a record high level. The ratio is an indicator of excess relative to actual economic performance.
Visit the Conference Board's site for coverage of leading indicator series from around the world.
Comments on the US economic outlook for 2004 from the Federal Reserve Bank of Atlanta can be found here.
| Business Cycle Indicators | Dec | Nov | Y/Y | 2003 | 2002 | 2001 |
|---|---|---|---|---|---|---|
| Leading | 0.2% | 0.2% | 2.9% | 1.3% | 2.2% | -0.8% |
| Coincident | 0.1% | 0.3% | 1.3% | 0.4% | -0.5% | -0.5% |
| Lagging | 0.1% | -0.3% | -2.2% | -2.1% | -2.8% | -1.4% |

Tom Moeller
AuthorMore in Author Profile »Prior to joining Haver Analytics in 2000, Mr. Moeller worked as the Economist at Chancellor Capital Management from 1985 to 1999. There, he developed comprehensive economic forecasts and interpreted economic data for equity and fixed income portfolio managers. Also at Chancellor, Mr. Moeller worked as an equity analyst and was responsible for researching and rating companies in the economically sensitive automobile and housing industries for investment in Chancellor’s equity portfolio. Prior to joining Chancellor, Mr. Moeller was an Economist at Citibank from 1979 to 1984. He also analyzed pricing behavior in the metals industry for the Council on Wage and Price Stability in Washington, D.C. In 1999, Mr. Moeller received the award for most accurate forecast from the Forecasters' Club of New York. From 1990 to 1992 he was President of the New York Association for Business Economists. Mr. Moeller earned an M.B.A. in Finance from Fordham University, where he graduated in 1987. He holds a Bachelor of Arts in Economics from George Washington University.
More Economy in Brief


