 Global| May 06 2004
Jobless Claims Lowest Since October 2000
by:Tom Moeller
|in:Economy in Brief
Summary
Initial claims for jobless insurance fell 25,000 last week to 315,000, the lowest level since October 2000. Consensus expectations had been for a decline to 338,000 claims. Claims during the prior week were revised up slightly. The [...]
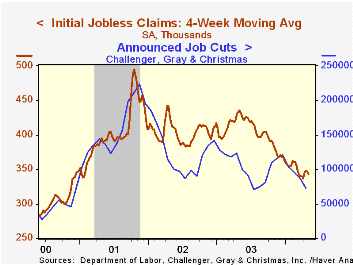
Initial claims for jobless insurance fell 25,000 last week to 315,000, the lowest level since October 2000. Consensus expectations had been for a decline to 338,000 claims. Claims during the prior week were revised up slightly.
The 4-week moving average of initial claims fell slightly to 343,250 (-21.1% y/y).
Continuing claims for unemployment insurance plunged 69,000 (2.3%) and the prior week's slight increase was revised to a slight decline.
The insured rate of unemployment fell to 2.3% from 2.4%. This unemployment rate averaged 2.8% during 2002 and 2003.
| Unemployment Insurance (000s) | 5/01/04 | 4/24/04 | Y/Y | 2003 | 2002 | 2001 |
|---|---|---|---|---|---|---|
| Initial Claims | 315 | 340 | -25.5% | 403 | 404 | 406 |
| Continuing Claims | -- | 2,945 | -19.0% | 3,533 | 3,573 | 3,023 |
by Tom Moeller May 6, 2004
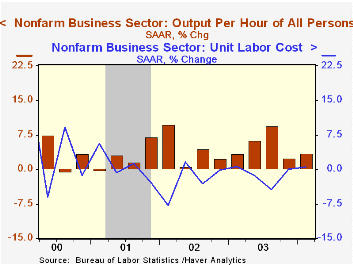
Non-farm labor productivity grew 3.5% last quarter, slightly firmer than Consensus expectations for 3.0% growth. Year-to-year growth in productivity of 5.4% remained near the highest level since the early 1960s.
Output rose 4.9% (5.8% y/y) and hours worked by all persons (employment times hours) rose 1.3% (0.4% y/y).
Unit labor costs grew a slight 0.5% as compensation growth rose to 4.0% from 2.5% in 4Q. It was the first rise in unit labor costs since 1Q03.
Productivity in the manufacturing sector grew 3.1% (5.3% y/y), the weakest quarterly growth rate since 2Q03. Unit labor costs in the factory sector rose 2.0% (-0.4% y/y), the first gain since 2Q03.
| Non-farm Business Sector (SAAR) | 1Q '04 (Prelim) | 4Q '03 (Final) | Y/Y | 2003 | 2002 | 2001 |
|---|---|---|---|---|---|---|
| Output per Hour | 3.5% | 2.5% | 5.4% | 4.4% | 4.9% | 2.2% |
| Compensation | 4.0% | 2.5% | 4.0% | 3.4% | 2.3% | 4.0% |
| Unit Labor Costs | 0.5% | 0.0% | -1.3% | -0.9% | -2.5% | 1.7% |
by Tom Moeller May 6, 2004
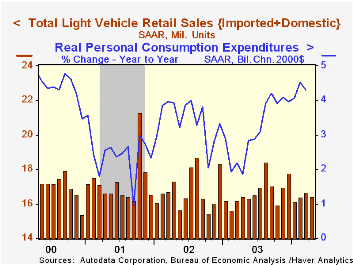
Unit sales of light vehicles fell 1.6% (0.0% y/y) in April to 16.41M following m/m gains during the prior two months. Consensus expectations were for sales of 16.7M.
Car sales slipped 4.7% to 7.36M to the lowest level since January. Sales of light trucks firmed 1.1% following a very slight March gain.
Domestic light vehicle sales fell 1.6% m/m to 13.10M (+0.2% y/y). Imported vehicle sales edged 1.5% lower to 3.31M (-0.6% y/y).
Imports' share of the US market for new vehicles in April held at 20.2% versus 19.7% during 2003.
| Light Vehicle Sales (SAAR, Mil.Units) | April | Mar | Y/Y | 2003 | 2002 | 2001 |
|---|---|---|---|---|---|---|
| Total | 16.41 | 16.68 | 0.0% | 16.69 | 16.81 | 17.26 |
| Autos | 7.36 | 7.72 | -2.6% | 7.63 | 8.07 | 8.48 |
| Trucks | 9.06 | 8.96 | 2.2% | 9.06 | 8.74 | 8.78 |

Tom Moeller
AuthorMore in Author Profile »Prior to joining Haver Analytics in 2000, Mr. Moeller worked as the Economist at Chancellor Capital Management from 1985 to 1999. There, he developed comprehensive economic forecasts and interpreted economic data for equity and fixed income portfolio managers. Also at Chancellor, Mr. Moeller worked as an equity analyst and was responsible for researching and rating companies in the economically sensitive automobile and housing industries for investment in Chancellor’s equity portfolio. Prior to joining Chancellor, Mr. Moeller was an Economist at Citibank from 1979 to 1984. He also analyzed pricing behavior in the metals industry for the Council on Wage and Price Stability in Washington, D.C. In 1999, Mr. Moeller received the award for most accurate forecast from the Forecasters' Club of New York. From 1990 to 1992 he was President of the New York Association for Business Economists. Mr. Moeller earned an M.B.A. in Finance from Fordham University, where he graduated in 1987. He holds a Bachelor of Arts in Economics from George Washington University.
More Economy in Brief


