Global| Nov 16 2009
Japanese GDP Growth In Q3 Surprises: Due To Increased Demand Or Inventory Building?
Summary
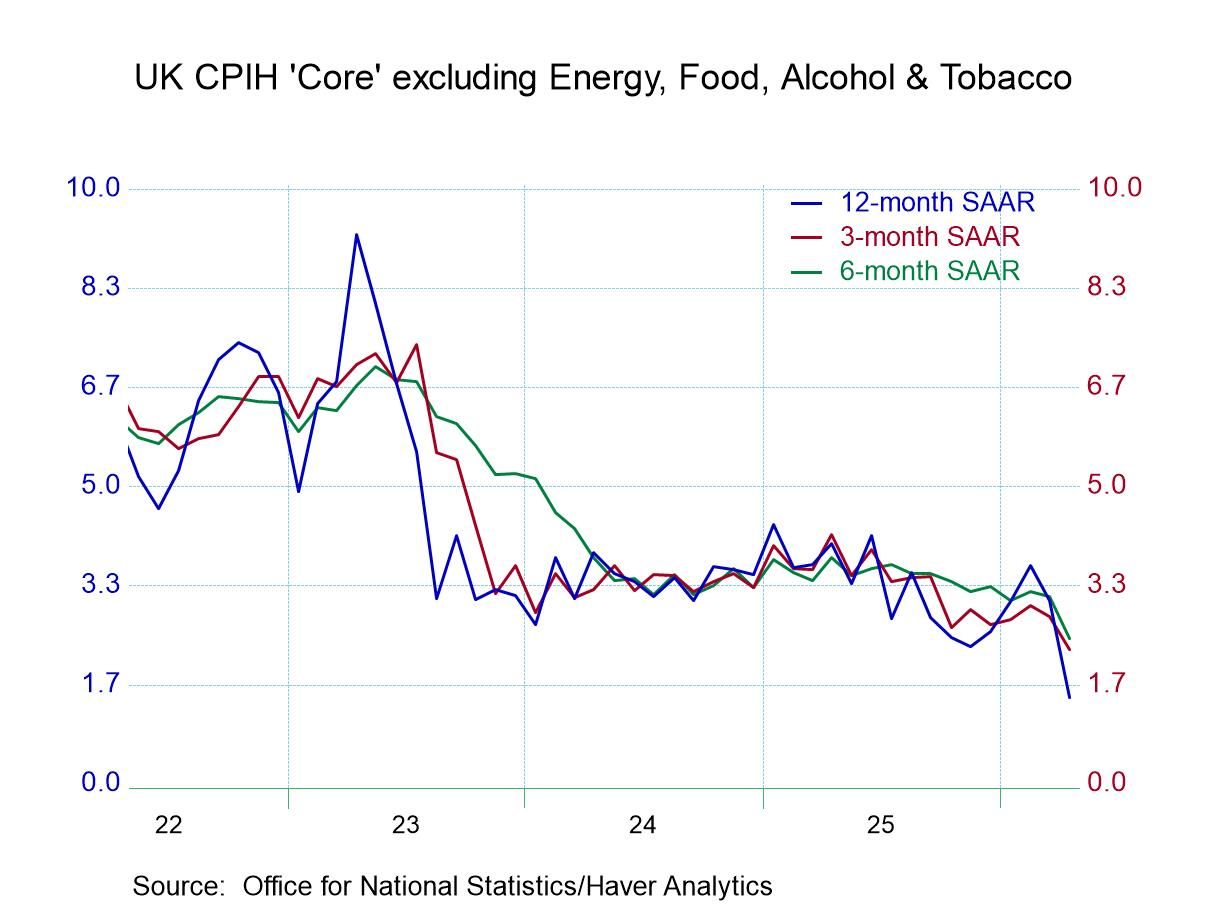
The Japanese economy grew more than expected in the third quarter. The annual rate of increase was 4.79% continuing the recovery that began in the second quarter with an annual rate of increase of 2.72%. The annual rates of change in [...]
 The Japanese
economy grew more than expected in the third quarter. The
annual rate of increase was 4.79% continuing the recovery that began in
the second quarter with an annual rate of increase of 2.72%.
The annual rates of change in private consumption and fixed investment
and the annual rate of difference in net exports are show in the first
chart. Japan still has a long way to go to recoup the losses from the
recent deep depression. The annual rate of real GDP in the
third quarter was 531.3 trillion yen, compared the 569.1 trillion yen
reached in the first quarter of 2008.
The Japanese
economy grew more than expected in the third quarter. The
annual rate of increase was 4.79% continuing the recovery that began in
the second quarter with an annual rate of increase of 2.72%.
The annual rates of change in private consumption and fixed investment
and the annual rate of difference in net exports are show in the first
chart. Japan still has a long way to go to recoup the losses from the
recent deep depression. The annual rate of real GDP in the
third quarter was 531.3 trillion yen, compared the 569.1 trillion yen
reached in the first quarter of 2008.
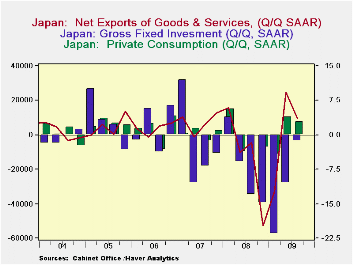
 Although both net exports and
private consumption continued to increase in the third quarter, their
annual rates of increase were lower than those in the second
quarter. Even with a lower rate decline in Gross Fixed
Domestic Investment, from 10.5% in the second quarter to 1.3 % in the
third quarter, the net effect of these factors does not appear to
account for the sharp increase reported for total GDP in the third
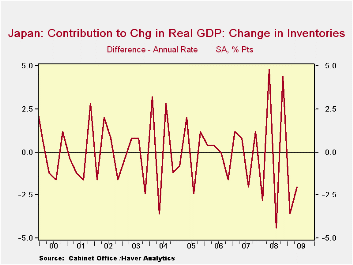
quarter. It should be noted that the data are preliminary and
some of the components, notably the change in inventories, is only
updated during the 2nd preliminary release. Given the
volatility and the large positive and negative contributions of
inventory changes to total growth, as shown in the second chart, it is
highly likely that the missing element in Japan's third quarter growth
was due to inventory accumulation.
Although both net exports and
private consumption continued to increase in the third quarter, their
annual rates of increase were lower than those in the second
quarter. Even with a lower rate decline in Gross Fixed
Domestic Investment, from 10.5% in the second quarter to 1.3 % in the
third quarter, the net effect of these factors does not appear to
account for the sharp increase reported for total GDP in the third
quarter. It should be noted that the data are preliminary and
some of the components, notably the change in inventories, is only
updated during the 2nd preliminary release. Given the
volatility and the large positive and negative contributions of
inventory changes to total growth, as shown in the second chart, it is
highly likely that the missing element in Japan's third quarter growth
was due to inventory accumulation.
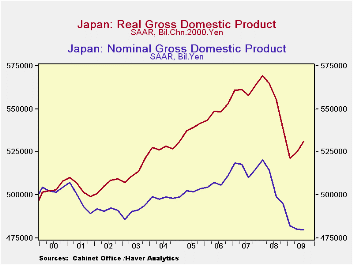
 Deflation continues to
characterize the Japanese economy. The third chart shows GDP
in nominal and real terms since 2000 when real GDP began to exceed
nominal, indicating a declining price
level.
Deflation continues to
characterize the Japanese economy. The third chart shows GDP
in nominal and real terms since 2000 when real GDP began to exceed
nominal, indicating a declining price
level.
| Q3 09 | Q2 09 | Q1 09 | Q4 08 | Q3 08 | Q2 08 | Q1 08 | |||
|---|---|---|---|---|---|---|---|---|---|
| Private Consumption (SAAR) | 2.8 | 3.9 | -4.3 | -2.8 | 0.0 | -3.7 | 5.66 | ||
| Fixed Investment (SAAR) | -1.3 | -10.5 | -26.6 | -14.9 | -13.1 | -5.9 | 3.9 | ||
| Net Exports (SAAD) Trillion Yen | 9.8 | 244 | -32.7 | -52.7 | -4.6 | -10.3 | 15.7 | ||
| GDP | 2008 | 2007 | 2006 | 2005 | 2004 | 2003 | 2002 | 2001 | 2000 |
| Real (Trillion 2000Chn Yen) | 556.6 | 560.5 | 547.7 | 536.8 | 526.6 | 512.5 | 505.4 | 504.5 | 503.1 |
| Nominal (Trillion Yen) | 507.6 | 515.8 | 507.4 | 501.7 | 515.8 | 490.3 | 491.3 | 497.7 | 503.0 |
More Economy in Brief