Global| Nov 12 2007
Japanese Consumers Becoming More Pessimistic
Summary
Another indicator that all is not well in Japan was released today. The seasonally unadjusted diffusion index of consumer confidence for a two or more person household was 42.8% in October, compared with 44.1% in September and 48.2% [...]

Another indicator that all is not well in Japan was released today.
The seasonally unadjusted diffusion index of consumer confidence for a
two or more person household was 42.8% in October, compared with 44.1%
in September and 48.2% in October, 2006. A value below 50% means that
the majority of the participants in the survey have a negative view of
the outlook. While the decline in October is significant, it should be
noted that since June, 1982, when the series began, there have been few
times when the level of the index was above 50% as can
be seen in the first chart. Japanese consumers have not been
particularly optimistic over the past twenty-five years. Monthly data
for confidence are available only since December 2004.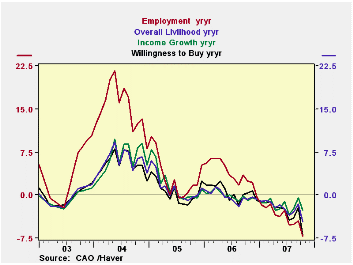
The index is based on the average of four sentiment indexes: Overall Livelihood, Income Growth, Employment and Willingness to Buy. The year to year changes in each of these indexes are shown in the second chart. As shown there, the year to year changes have been declining from their early 2006 peak and, since early 2007, have become negative. The declines in the Employment and Willingness to Buy indexes have been particularly sharp.
| JAPAN: CONSUMER CONFIDENCE (Diffusion Indexes) | Oct 07 | Sep 07 | Oct 06 | M/M Chg | Y/Y Chg | 2006 | 2005 | 2004 |
|---|---|---|---|---|---|---|---|---|
| Total: Two or More Persons Households | 42.8 | 44.1 | 48.2 | -1.3 | -5.4 | 48.3 | 47.3 | 45.6 |
| Overall Livelihood | 41.0 | 42.2 | 45.6 | -1.2 | -4.6 | 45.6 | 45.8 | 44.6 |
| Income Growth | 42.2 | 42.4 | 44.9 | -0.3 | -1.9 | 44.7 | 44.8 | 43.1 |
| Employment | 45.3 | 46.4 | 52.4 | -1.1 | -7.1 | 52.8 | 48.9 | 45.8 |
| Willingness to Buy | 42.5 | 45.5 | 49.8 | -2.7 | -7.0 | 50.0 | 49.5 | 48.9 |
More Economy in Brief