 Global| Aug 05 2003
ISM Nonmanufacturing Index Strong
by:Tom Moeller
|in:Economy in Brief
Summary
The Institute for Supply Management reported that its July index of activity in the nonmanufacturing sector rose to the highest level in the series brief seven year history. The index rose to 65.1 versus Consensus expectations for a [...]
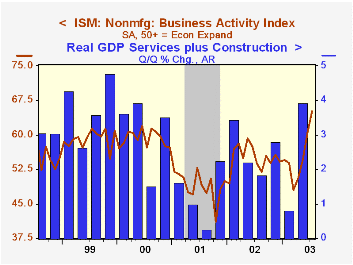
The Institute for Supply Management reported that its July index of activity in the nonmanufacturing sector rose to the highest level in the series brief seven year history. The index rose to 65.1 versus Consensus expectations for a rise to 58.0.
The 4.5 point m/m rise followed a 6.1 point gain in June and over the last four months the activity index has jumped 17.2 points.
During the last five years, there has been a 66% correlation between the level of the Business Activity Index from the ISM nonmanufacturing survey and quarterly growth in real GDP in the service sector plus structures.
The seasonally adjusted new orders index jumped to a record high 66.9. The employment index also improved to 50.7, the third month above 50 since early 2001. During the last five years there has been a 68% correlation between the level of the ISM nonmanufacturing employment index and the m/m change in payroll employment in the service producing and construction industries.Business activity for the nonmanufacturing sector is a question separate from the subgroups mentioned above. In contrast, the NAPM manufacturing sector composite index weights the components.
The seasonally adjusted prices index fell to 50.6 versus 53.9 during all of last year.
ISM surveys more than 370 purchasing managers in more than 62 industries including construction, law firms, hospitals, government and retailers. The nonmanufacturing survey dates only to July 1997, therefore its seasonal adjustment should be viewed tentatively.
| ISM Nonmanufacturing Survey | July | June | Y/Y | 2002 | 2001 | 2000 |
|---|---|---|---|---|---|---|
| Business Activity Index | 65.1 | 60.6 | 53.7 | 55.1 | 49.0 | 59.3 |
| Prices Index | 50.6 | 51.4 | 59.1 | 53.9 | 51.6 | 63.5 |
by Tom Moeller August 5, 2003
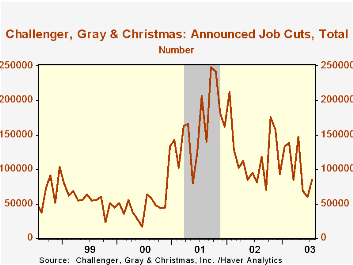
According to Challenger, Gray & Christmas, announced job cuts rose last month from very depressed levels in May and June. Layoff announcements rose 42.5% in July versus June.
The three month moving average of job cut announcements collapsed to its lowest level since November 2000.
Job cut announcements differ from layoffs in that many are achieved through attrition or just never occur.
During the last nine years there has been a 72% correlation between the y/y change in announced job cuts and the y/y percent change in initial claims for jobless insurance. Like claims, job cut announcements indicate little about new hiring activity.
The increase in job cut announcements m/m was dominated by huge gains in a few industries including aerospace, consumer goods, government and services. Elsewhere announcements were mixed.
| Challenger, Gray & Christmas | July | June | Y/Y | 2002 | 2001 |
|---|---|---|---|---|---|
| Announced Job Cuts | 85,117 | 59,715 | 5.1% | 1,431,052 | 1,956,876 |
by Tom Moeller August 5, 2003
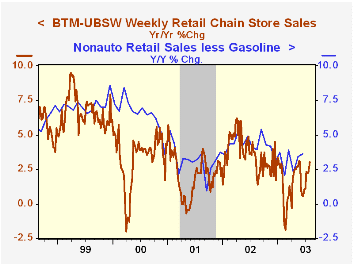
Chain store sales rose 0.8% last week, rising for the fourth week in the last five according to the BTM-UBSW survey.
For all of July sales rose 1.4% from the June average which was barely changed from May.
During the last five years there has been a 62% correlation between the year-to-year percent change in chain store sales and the change in nonauto retail sales less gasoline.
The BTM-UBSW retail chain-store sales index is constructed from the sales results reported by seven retailers: Dayton Hudson, Federated, Kmart, May, J.C. Penney, Sears and Wal-Mart.
| BTM-UBSW (SA, 1977=100) | 8/2/03 | 7/26/03 | Y/Y | 2002 | 2001 | 2000 |
|---|---|---|---|---|---|---|
| Total Weekly Retail Chain Store Sales | 427.7 | 424.1 | 3.0% | 3.6% | 2.1% | 3.4% |

Tom Moeller
AuthorMore in Author Profile »Prior to joining Haver Analytics in 2000, Mr. Moeller worked as the Economist at Chancellor Capital Management from 1985 to 1999. There, he developed comprehensive economic forecasts and interpreted economic data for equity and fixed income portfolio managers. Also at Chancellor, Mr. Moeller worked as an equity analyst and was responsible for researching and rating companies in the economically sensitive automobile and housing industries for investment in Chancellor’s equity portfolio. Prior to joining Chancellor, Mr. Moeller was an Economist at Citibank from 1979 to 1984. He also analyzed pricing behavior in the metals industry for the Council on Wage and Price Stability in Washington, D.C. In 1999, Mr. Moeller received the award for most accurate forecast from the Forecasters' Club of New York. From 1990 to 1992 he was President of the New York Association for Business Economists. Mr. Moeller earned an M.B.A. in Finance from Fordham University, where he graduated in 1987. He holds a Bachelor of Arts in Economics from George Washington University.
More Economy in Brief


