 Global| Oct 05 2004
ISM Non-manufacturing Index Down Unexpectedly
by:Tom Moeller
|in:Economy in Brief
Summary
The September Business Activity Index for the non-manufacturing sector fell to 56.7 from 58.2 in August, reported the Institute for Supply Management. Consensus expectations had been for a moderate gain to 59.0. Since the series' [...]
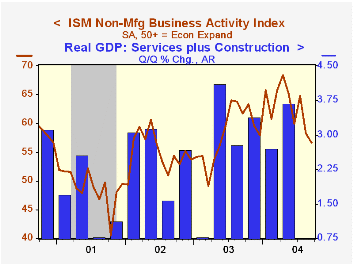
The September Business Activity Index for the non-manufacturing sector fell to 56.7 from 58.2 in August, reported the Institute for Supply Management. Consensus expectations had been for a moderate gain to 59.0.
Since the series' inception in 1997 there has been a 55% correlation between the Business Activity Index and the q/q change in GDP services plus construction.
The employment sub index continued to rise, adding 2.1 points to the 2.5 point gain in August. Since the series' inception in 1997 there has been a 60% correlation between the level of the ISM non-manufacturing employment index and the m/m change in payroll employment in the service producing plus the construction industries.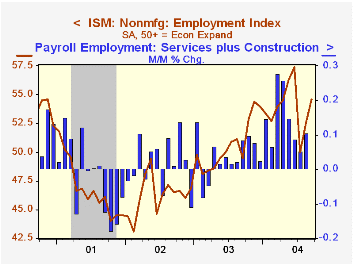
The new orders index was about unchanged at 58.5 versus 58.6 in August.
The seasonally adjusted prices index fell to 67.1 versus 70.0 in August.Business Activity Index for the non-manufacturing sector reflects a question separate from the subgroups mentioned above. In contrast, the NAPM manufacturing sector composite index is a weighted average five components.
ISM surveys more than 370 purchasing managers in more than 62 industries including construction, law firms, hospitals, government and retailers. The non-manufacturing survey dates only to July 1997, therefore its seasonal adjustment should be viewed tentatively.
| ISM Nonmanufacturing Survey | Sep | Aug | Sep '03 | 2003 | 2002 | 2001 |
|---|---|---|---|---|---|---|
| Business Activity Index | 56.7 | 58.2 | 61.7 | 58.1 | 55.1 | 48.9 |
| Prices Index | 67.1 | 70.0 | 58.9 | 56.7 | 53.9 | 51.5 |
by Tom Moeller October 5, 2004
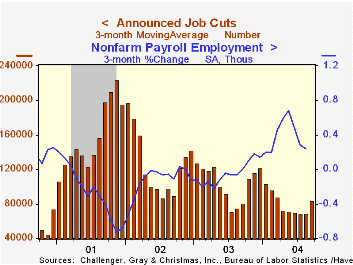
Challenger, Gray & Christmas reported that announced job cuts surged 45.5% in September following moderate gains in four of the prior five months. The increase to 107,863 was to the highest level since January.
The three month moving average of job cut announcements rose to 83,862 (+4.2% y/y).
During the last ten years there has been an 86% (inverse) correlation between the three month moving average of announced job cuts and the three month change payroll employment.
Job cut announcements differ from layoffs. Many are achieved through attrition, early retirement or just never occur.
Announced hiring plans in September slipped sharply after having surged in August. The series dates back only to May.
"Why Are We Losing Manufacturing Jobs?" from the federal Reserve Bank of Cleveland can be found here.
| Challenger, Gray & Christmas | Sep | Aug | Y/Y | 2003 | 2002 | 2001 |
|---|---|---|---|---|---|---|
| Announced Job Cuts | 107,863 | 74,150 | 41.0% | 1,236,426 | 1,431,052 | 1,956,876 |
by Tom Moeller October 5, 2004
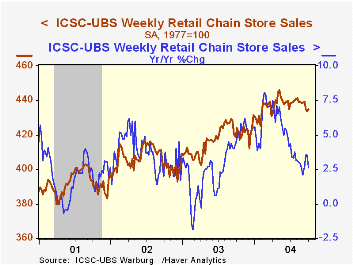
Chain store sales rebounded a modest 0.3% last week following two weeks of pounding by hurricanes, according to the International Council of Shopping Centers (ICSC)-UBS.
Sales began October 0.4% below the September average which fell 0.7% versus August.
During the last ten years there has been a 60% correlation between y/y change in chain store sales and the change in non-auto retail sales less gasoline.
The ICSC-UBS retail chain-store sales index is constructed using the same-store sales reported by 78 stores of seven retailers: Dayton Hudson, Federated, Kmart, May, J.C. Penney, Sears and Wal-Mart.
| ICSC-UBS (SA, 1977=100) | 10/02/04 | 09/25/04 | Y/Y | 2003 | 2002 | 2001 |
|---|---|---|---|---|---|---|
| Total Weekly Retail Chain Store Sales | 435.0 | 433.5 | 2.6% | 2.9% | 3.6% | 2.1% |

Tom Moeller
AuthorMore in Author Profile »Prior to joining Haver Analytics in 2000, Mr. Moeller worked as the Economist at Chancellor Capital Management from 1985 to 1999. There, he developed comprehensive economic forecasts and interpreted economic data for equity and fixed income portfolio managers. Also at Chancellor, Mr. Moeller worked as an equity analyst and was responsible for researching and rating companies in the economically sensitive automobile and housing industries for investment in Chancellor’s equity portfolio. Prior to joining Chancellor, Mr. Moeller was an Economist at Citibank from 1979 to 1984. He also analyzed pricing behavior in the metals industry for the Council on Wage and Price Stability in Washington, D.C. In 1999, Mr. Moeller received the award for most accurate forecast from the Forecasters' Club of New York. From 1990 to 1992 he was President of the New York Association for Business Economists. Mr. Moeller earned an M.B.A. in Finance from Fordham University, where he graduated in 1987. He holds a Bachelor of Arts in Economics from George Washington University.
More Economy in Brief


