 Global| Jun 02 2003
ISM Indicates Factory Activity Improved Some
by:Tom Moeller
|in:Economy in Brief
Summary
The ISM Composite Index of manufacturing sector activity rose to 49.4 last month from 45.4 in April. The gain was a bit more than Consensus expectations for a rise to 48.5 but the index nevertheless was below 50 for the third [...]
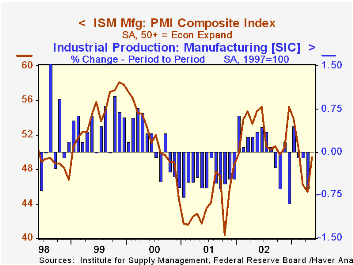
The ISM Composite Index of manufacturing sector activity rose to 49.4 last month from 45.4 in April. The gain was a bit more than Consensus expectations for a rise to 48.5 but the index nevertheless was below 50 for the third consecutive month.
During the last ten years there has been a 52% correlation between the level of the ISM index and the month to month change in factory sector industrial production.
New orders, production and the vendor delivery index moved higher and each was above 50, the dividing line between expansion and contraction. Employment and inventories also rose but remained below 50.
The separate index of inflation pressure fell sharply to the lowest level since March of last year. This index is not seasonally adjusted.
| ISM Manufacturing Survey | May | April | Y/Y | 2002 | 2001 | 2000 |
|---|---|---|---|---|---|---|
| Composite Index | 49.4 | 45.4 | 54.7 | 52.4 | 44.0 | 51.7 |
| Prices Paid Index (NSA) | 51.5 | 63.5 | 65.0 | 57.6 | 42.9 | 64.8 |
by Tom Moeller June 2, 2003
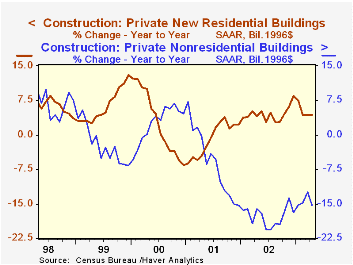
The value of construction put in place fell 0.3% (+0.7% y/y) in April versus consensus expectations for a slight rise. The sharp 1.0% decline in March spending was unrevised.
In constant 1996 dollars, overall construction spending fell 0.3% (-2.9% y/y) in April.
The value of construction in the private sector fell 0.4% (+0.7% y/y) for the second consecutive month. A sharp 2.6% decline in nonresidential construction reflected a huge 7.0% (-24.0% y/y) decline in industrial building as well as a 7.4% (-23.0% y/y) drop in office construction.
Residential building expenditures also fell for the second consecutive month. Adjusted for inflation, residential spending actually fell for the third consecutive month (-0.4% m/m, +4.3% y/y).
| Construction Put-in-place | April | Mar | Y/Y | 2002 | 2001 | 2000 |
|---|---|---|---|---|---|---|
| Total | -0.3% | -1.0% | 0.7% | 0.7% | 2.5% | 7.3% |
| Residential | -0.3% | -0.2% | 9.3% | 7.1% | 3.3% | 7.4% |
| Nonresidential | -2.6% | 0.3% | -13.1% | -16.4% | -3.1% | 7.1% |
| Public | 0.2% | -3.0% | 0.5% | 6.2% | 7.4% | 5.4% |

Tom Moeller
AuthorMore in Author Profile »Prior to joining Haver Analytics in 2000, Mr. Moeller worked as the Economist at Chancellor Capital Management from 1985 to 1999. There, he developed comprehensive economic forecasts and interpreted economic data for equity and fixed income portfolio managers. Also at Chancellor, Mr. Moeller worked as an equity analyst and was responsible for researching and rating companies in the economically sensitive automobile and housing industries for investment in Chancellor’s equity portfolio. Prior to joining Chancellor, Mr. Moeller was an Economist at Citibank from 1979 to 1984. He also analyzed pricing behavior in the metals industry for the Council on Wage and Price Stability in Washington, D.C. In 1999, Mr. Moeller received the award for most accurate forecast from the Forecasters' Club of New York. From 1990 to 1992 he was President of the New York Association for Business Economists. Mr. Moeller earned an M.B.A. in Finance from Fordham University, where he graduated in 1987. He holds a Bachelor of Arts in Economics from George Washington University.
More Economy in Brief


