 Global| Dec 03 2007
ISM Index Still Low at an Expected 50.8
by:Tom Moeller
|in:Economy in Brief
Summary
For November, the Institute of Supply Management (ISM) reported that its Composite Index of Manufacturing Sector Activity was about unchanged from the October level. The figure of 50.8 essentially met Consensus expectations for a [...]
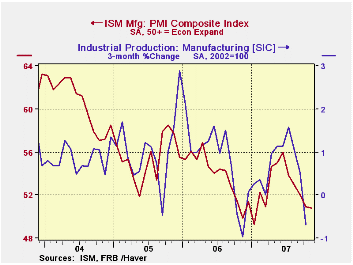
For November, the Institute of Supply Management (ISM) reported that its Composite Index of Manufacturing Sector Activity was about unchanged from the October level. The figure of 50.8 essentially met Consensus expectations for a reading of 50.7. Data points above 50 indicates growth in factory sector activity.
Last month's PMI figure remained the lowest since January when industrial production in the factory sector fell 0.6% and the three month % change in factory sector output fell to 0.4%.
During the last twenty years there has been a 64% correlation between the level of the Composite Index and the three month growth in factory sector industrial production.
It is appropriate to correlate the ISM index level
with factory sector growth because the ISM index
is a diffusion index. It measures growth by being constructed using all
of the absolute positive changes in activity added to one half of the
no change in activity measures.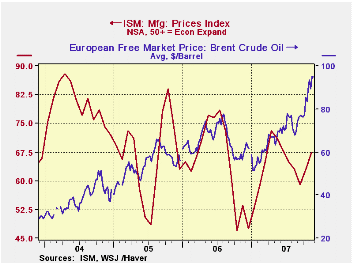
New orders, vendor deliveries & inventories, three of the index's five components, remained near the October level. The employment index, however, fell sharply in November to its lowest since 2003. During the last twenty years there has been a 67% correlation between the level of the ISM employment Index and the three month growth in factory sector employment.
Some of that decline in employment was offset by a rise in production.
The index of new export orders rose sharply m/m to 58.5, its highest level since this past May. The import index conversely remained at the October level (47.5), the lowest level since 2001. That suggests imports declined last month.
The Unsustainable US Current Account Position
Revisited* is a 2005 National Bureau of Economic Research
working paper by Maurice Obtsfeld & Kenneth Rogoff and the
abstract from it can be found
here.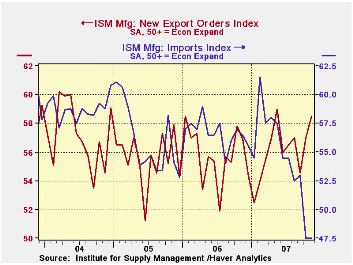
The prices paid index again moved much higher, reflecting the near $11 m/m surge in Brent crude oil costs, to the highest level since July. During the last twenty years there has been a 77% correlation between the price index and the three month change in the PPI for intermediate goods.
Asian nations driving world oil prices from the Federal Reserve Bank of St. Louis is available here.
| November | October | October'06 | 2006 | 2005 | 2004 | |
|---|---|---|---|---|---|---|
| Composite Index | 50.8 | 50.9 | 49.9 | 53.9 | 55.5 | 60.5 |
| New Orders Index | 52.6 | 52.5 | 49.7 | 55.4 | 57.4 | 63.5 |
| Prices Paid Index (NSA) | 67.5 | 63.0 | 53.5 | 65.0 | 66.4 | 79.8 |

Tom Moeller
AuthorMore in Author Profile »Prior to joining Haver Analytics in 2000, Mr. Moeller worked as the Economist at Chancellor Capital Management from 1985 to 1999. There, he developed comprehensive economic forecasts and interpreted economic data for equity and fixed income portfolio managers. Also at Chancellor, Mr. Moeller worked as an equity analyst and was responsible for researching and rating companies in the economically sensitive automobile and housing industries for investment in Chancellor’s equity portfolio. Prior to joining Chancellor, Mr. Moeller was an Economist at Citibank from 1979 to 1984. He also analyzed pricing behavior in the metals industry for the Council on Wage and Price Stability in Washington, D.C. In 1999, Mr. Moeller received the award for most accurate forecast from the Forecasters' Club of New York. From 1990 to 1992 he was President of the New York Association for Business Economists. Mr. Moeller earned an M.B.A. in Finance from Fordham University, where he graduated in 1987. He holds a Bachelor of Arts in Economics from George Washington University.
More Economy in Brief


