 Global| Aug 01 2008
ISM Index Roughly About Stable M/M But Still Up From Recent Lows
by:Tom Moeller
|in:Economy in Brief
Summary
The Institute for Supply Management 's Composite Index of Manufacturing Sector Activity fell very slightly month-to-month during July to a break-even 50 from 50.2 in June. Still, the index is up from the monthly lows near 48 this past [...]
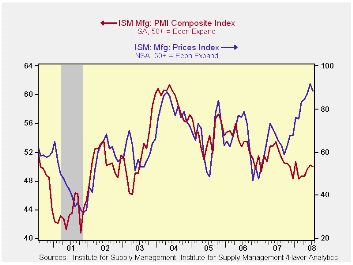
The Institute for Supply Management 's Composite Index of Manufacturing Sector Activity fell very slightly month-to-month during July to a break-even 50 from 50.2 in June. Still, the index is up from the monthly lows near 48 this past winter. Consensus expectations had been for more of a decline to 49.1 in July.
Despite the very recent improvement, the index's average level so far this year of 49.4 was its lowest since early-2003.
During the last twenty years there has been a 64% correlation between the level of the Composite Index and the three-month growth in factory sector industrial production.
It is appropriate to correlate the ISM index level with factory sector growth because the ISM index is a diffusion index. It measures growth by using all of the positive changes in activity added to one half of the zero change in activity measures.
The employment index improved markedly last month to a level of 51.9. That was the first reading above the break-even level of 50 since October. During the last twenty years there has been a 67% correlation between the level of the ISM employment index and the three-month growth in factory sector employment.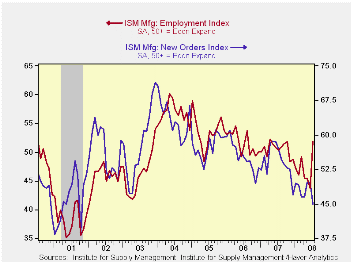
The new orders index, however, offset that rise with a decline to 45.0 which was its lowest level since the recession of 2001. The new export orders sub-series declined sharply to 54.0 which was its lowest reading since last December. During the last ten years there has been a 53% correlation between the index and the q/q change in real exports of goods in the GDP accounts.
The production index rose modestly to 52.9 but the inventories series fell sharply to 45.0.
Prices paid backed off a bit to a still high index level of 88.5. During the last twenty years there has been a 79% correlation between the price index and the three-month change in the PPI for intermediate goods.
| ISM Mfg | July | June | July '07 | 2007 | 2006 | 2005 |
|---|---|---|---|---|---|---|
| Composite Index | 50.0 | 50.2 | 52.3 | 51.1 | 53.1 | 54.4 |
| New Orders Index | 45.0 | 49.6 | 56.9 | 54.3 | 55.4 | 57.4 |
| Employment Index | 51.9 | 43.7 | 50.3 | 50.5 | 51.7 | 53.6 |
| Prices Paid Index (NSA) | 88.5 | 91.5 | 65.0 | 64.6 | 65.0 | 66.4 |

Tom Moeller
AuthorMore in Author Profile »Prior to joining Haver Analytics in 2000, Mr. Moeller worked as the Economist at Chancellor Capital Management from 1985 to 1999. There, he developed comprehensive economic forecasts and interpreted economic data for equity and fixed income portfolio managers. Also at Chancellor, Mr. Moeller worked as an equity analyst and was responsible for researching and rating companies in the economically sensitive automobile and housing industries for investment in Chancellor’s equity portfolio. Prior to joining Chancellor, Mr. Moeller was an Economist at Citibank from 1979 to 1984. He also analyzed pricing behavior in the metals industry for the Council on Wage and Price Stability in Washington, D.C. In 1999, Mr. Moeller received the award for most accurate forecast from the Forecasters' Club of New York. From 1990 to 1992 he was President of the New York Association for Business Economists. Mr. Moeller earned an M.B.A. in Finance from Fordham University, where he graduated in 1987. He holds a Bachelor of Arts in Economics from George Washington University.
More Economy in Brief


