 Global| Oct 01 2008
ISM Index Plunged to Recession Level
by:Tom Moeller
|in:Economy in Brief
Summary
The Institute for Supply Management reported that it's Composite Index of Manufacturing Sector Activity plunged to its lowest level since the end of the 2001 recession. The decline to 43.5 in September from an August reading of 49.9 [...]
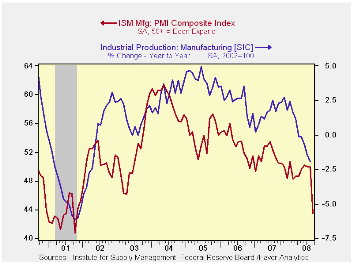
The Institute for Supply Management reported that it's Composite Index of Manufacturing Sector Activity plunged to its lowest level since the end of the 2001 recession. The decline to 43.5 in September from an August reading of 49.9 by far exceeded Consensus expectations for a roughly unchanged level of 49.5. The break-even level for this measure of factory sector activity is 50.
During the last twenty years there has been a 64% correlation between the level of the Composite Index and the three-month growth in factory sector industrial production.
It is appropriate to correlate the ISM index level with factory sector growth because the ISM index is a diffusion index. It measures growth by using all of the positive changes in activity added to one half of the zero change in activity measures.
The production sub-series led the decline in the composite index with an 11.3 point drop to 40.8, the lowest level since early 1991.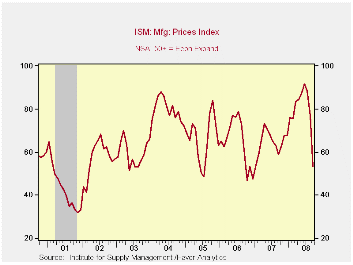
The new orders index followed closely and fell 9.5 points to 38.8. The new export orders sub-series held up, comparatively, and fell 5 points to a break-even level of 50. During the last ten years there has been a 53% correlation between the index and the q/q change in real exports of goods in the GDP accounts.
The employment index fell 7.9 points to 41.8, the lowest reading since early 2003. During the last twenty years there has been a 67% correlation between the level of the ISM employment index and the three-month growth in factory sector employment.
The inventories series fell to 43.4 and that reversed most of the August increase. Suppler deliveries rose slightly while order backlogs declined to their lowest level since early 2001.
Prices paid fell sharply, again. The index fell 23.5 points to 53.5 which was its lowest level since early 2007. That further reflected the recent decline in oil prices. During the last twenty years there has been a 79% correlation between the price index and the three-month change in the PPI for intermediate goods.
The Big Mac: A Global-to-Local Look at Pricing from the Federal Reserve Bank of Dallas is available here.
| ISM Mfg | September | August | September '07 | 2007 | 2006 | 2005 |
|---|---|---|---|---|---|---|
| Composite Index | 43.5 | 49.9 | 50.5 | 51.1 | 53.1 | 54.4 |
| New Orders Index | 38.8 | 48.3 | 53.6 | 54.3 | 55.4 | 57.4 |
| Employment Index | 41.8 | 49.7 | 51.5 | 50.5 | 51.7 | 53.6 |
| Prices Paid Index (NSA) | 53.5 | 77.0 | 59.0 | 64.6 | 65.0 | 66.4 |

Tom Moeller
AuthorMore in Author Profile »Prior to joining Haver Analytics in 2000, Mr. Moeller worked as the Economist at Chancellor Capital Management from 1985 to 1999. There, he developed comprehensive economic forecasts and interpreted economic data for equity and fixed income portfolio managers. Also at Chancellor, Mr. Moeller worked as an equity analyst and was responsible for researching and rating companies in the economically sensitive automobile and housing industries for investment in Chancellor’s equity portfolio. Prior to joining Chancellor, Mr. Moeller was an Economist at Citibank from 1979 to 1984. He also analyzed pricing behavior in the metals industry for the Council on Wage and Price Stability in Washington, D.C. In 1999, Mr. Moeller received the award for most accurate forecast from the Forecasters' Club of New York. From 1990 to 1992 he was President of the New York Association for Business Economists. Mr. Moeller earned an M.B.A. in Finance from Fordham University, where he graduated in 1987. He holds a Bachelor of Arts in Economics from George Washington University.
More Economy in Brief


