 Global| Mar 03 2008
ISM Index Factory Sector Falls Below 50: Indicates Contraction
by:Tom Moeller
|in:Economy in Brief
Summary
For the second month in the last three, the Institute of Supply Management (ISM) reported that its Composite Index of Manufacturing Sector Activity was below the breakeven level of 50. The m/m decline to 48.3 was right in line with [...]
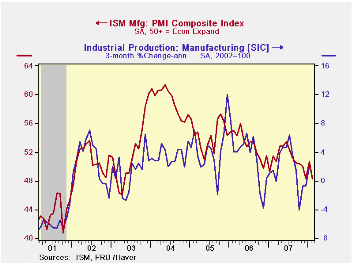
For the second month in the last three, the Institute of Supply Management (ISM) reported that its Composite Index of Manufacturing Sector Activity was below the breakeven level of 50. The m/m decline to 48.3 was right in line with Consensus expectations for a drop to 48.4. Data points above 50 indicate growth in factory sector activity.
Last month's composite reading was down from 50.7 in January and 48.4 in December. The three month average level of 49.1 was its lowest since early 2003.
During the last twenty years there has been a 64% correlation between the level of the Composite Index and the three month growth in factory sector industrial production.
It is appropriate to correlate the ISM index level with factory sector growth because the ISM index is a diffusion index. It measures growth by being constructed using all of the absolute positive changes in activity added to one half of the no change in activity measures.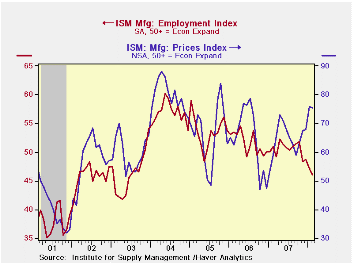
Sharp declines in each of the five component series, excepting new orders, contributed to last month's decline in the composite index. Production fell 4.5 points and reversed most of its January recovery. The inventory component fell 3.7 points and reversed all of its January rise while the vendor deliveries component fell 2.7 points to the lowest level since 2003.
The employment index fell a sharp 1.1 points, repeating most of the January decline, to the lowest level since 2003. During the last twenty years there has been a 67% correlation between the level of the ISM employment Index and the three month growth in factory sector employment.
The new orders index fell a more moderate 0.4 points although domestic orders may have held up. The index of new export orders fell a sharp 2.5 points to 56.0, back to the average level during 4Q07 and 3Q07.
The prices paid index continued firm. A modest 0.5 point downtick during February followed very strong gains in three of the prior four months. That left the index at its highest level since August 2006. During the last twenty years there has been a 77% correlation between the price index and the three month change in the PPI for intermediate goods.
The Benefits of Systematic Monetary Policy is today's speech by Philadelphia Fed President Charles I. Plosser and it can be found here.
| ISM Mfg | February | January | February '07 | 2007 | 2006 | 2005 |
|---|---|---|---|---|---|---|
| Composite Index | 48.3 | 50.7 | 51.5 | 51.1 | 53.1 | 54.4 |
| New Orders Index | 49.1 | 49.5 | 55.4 | 54.3 | 53.4 | 57.4 |
| Employment Index | 46.0 | 47.1 | 50.9 | 50.5 | 51.7 | 53.6 |
| Prices Paid Index (NSA) | 75.5 | 76.0 | 59.0 | 64.6 | 65.0 | 66.4 |

Tom Moeller
AuthorMore in Author Profile »Prior to joining Haver Analytics in 2000, Mr. Moeller worked as the Economist at Chancellor Capital Management from 1985 to 1999. There, he developed comprehensive economic forecasts and interpreted economic data for equity and fixed income portfolio managers. Also at Chancellor, Mr. Moeller worked as an equity analyst and was responsible for researching and rating companies in the economically sensitive automobile and housing industries for investment in Chancellor’s equity portfolio. Prior to joining Chancellor, Mr. Moeller was an Economist at Citibank from 1979 to 1984. He also analyzed pricing behavior in the metals industry for the Council on Wage and Price Stability in Washington, D.C. In 1999, Mr. Moeller received the award for most accurate forecast from the Forecasters' Club of New York. From 1990 to 1992 he was President of the New York Association for Business Economists. Mr. Moeller earned an M.B.A. in Finance from Fordham University, where he graduated in 1987. He holds a Bachelor of Arts in Economics from George Washington University.
More Economy in Brief


