 Global| Sep 04 2007
ISM Index Down Slightly; As Expected
by:Tom Moeller
|in:Economy in Brief
Summary
The Institute of Supply Management (ISM) reported that the Composite Index of activity in the manufacturing sector fell slightly last month to 52.9 from 53.8 during July. Consensus expectations had been for a reading of 53.0. During [...]
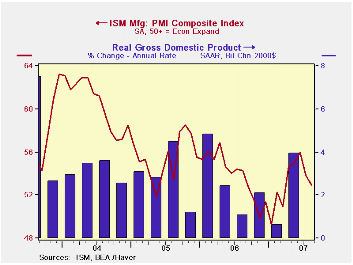
The Institute of Supply Management (ISM) reported that the Composite Index of activity in the manufacturing sector fell slightly last month to 52.9 from 53.8 during July. Consensus expectations had been for a reading of 53.0.
During the last twenty years there has been a 64% correlation between the level of the Composite Index and the three month growth in factory sector industrial production. It is appropriate to correlate the ISM index level with factory sector growth. The ISM index is a diffusion index. It measures growth by being constructed using all of the absolute change in activity added to one half of the no change in activity measures.
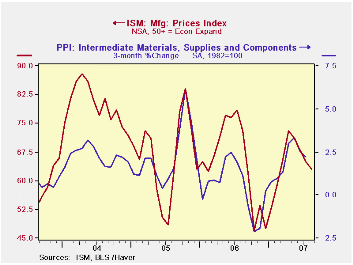
The prices index also fell two points to its lowest level since February. During the last twenty years there has been a 77% correlation between the price index and the three month change in the PPI for intermediate goods.
Declines in three of the index's five components led the composite index 's decline last month. New orders fell 2.2 points to its lowest since March. The inventory index and the supplier delivery measure fell as well. The employment index, however, rose to the highest level in four months and production index recouped a small piece of its sharp July decline. During the last twenty years there has been a 67% correlation between the level of the ISM employment Index and the three month growth in factory sector employment.
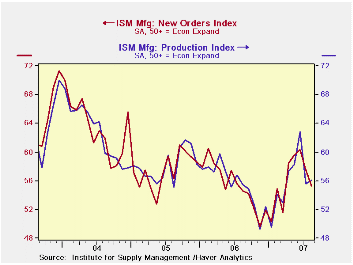
The index of new export orders rose slightly to its highest level in three months. The import index, however, fell sharply to its lowest level since 2003.
The prices paid index fell two points to its lowest level since February. During the last twenty years there has been a 77% correlation between the price index and the three month change in the PPI for intermediate goods.
| Composite Index | 52.9 | 53.8 | 54.3 | 53.9 | 55.5 | 60.5 | ||||||||||||||
| New Orders Index | 55.3 | 57.5 | 54.6 | 55.4 | 57.4 | 63.5 | ||||||||||||||
| Prices Paid Index (NSA) | 63.0 | 73.0 | 78.5 | 65.0 | 66.4 | 79.8 |

Tom Moeller
AuthorMore in Author Profile »Prior to joining Haver Analytics in 2000, Mr. Moeller worked as the Economist at Chancellor Capital Management from 1985 to 1999. There, he developed comprehensive economic forecasts and interpreted economic data for equity and fixed income portfolio managers. Also at Chancellor, Mr. Moeller worked as an equity analyst and was responsible for researching and rating companies in the economically sensitive automobile and housing industries for investment in Chancellor’s equity portfolio. Prior to joining Chancellor, Mr. Moeller was an Economist at Citibank from 1979 to 1984. He also analyzed pricing behavior in the metals industry for the Council on Wage and Price Stability in Washington, D.C. In 1999, Mr. Moeller received the award for most accurate forecast from the Forecasters' Club of New York. From 1990 to 1992 he was President of the New York Association for Business Economists. Mr. Moeller earned an M.B.A. in Finance from Fordham University, where he graduated in 1987. He holds a Bachelor of Arts in Economics from George Washington University.
More Economy in Brief


