 Global| May 01 2002
ISM Index Down Slightly
by:Tom Moeller
|in:Economy in Brief
Summary
The ISM Composite Index of manufacturing sector activity fell slightly more than expected last month. Consensus expectations were for an index reading of 55.0. The decline was in line with the moderate fall in the Chicago Purchasing [...]
The ISM Composite Index of manufacturing sector activity fell slightly more than expected last month. Consensus expectations were for an index reading of 55.0. The decline was in line with the moderate fall in the Chicago Purchasing agents' index reported yesterday.
The components of the ISM index were mixed. New orders and employment fell while production, inventories and supplier deliveries rose.
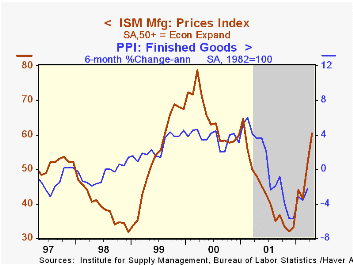
Inflation pressure rose sharply, the price index moving to its highest level since January 2001.
Over the last twenty years there has been a 75% correlation between the ISM Composite Index and 3-month growth in factory production.
| ISM Manufacturing Survey | April | Mar | Y/Y | 2001 | 2000 | 1999 |
|---|---|---|---|---|---|---|
| Composite Index | 53.9 | 55.6 | 43.2 | 43.9 | 51.6 | 54.6 |
| Prices Paid Index | 60.3 | 51.9 | 48.0 | 43.0 | 64.8 | 54.2 |
by Tom Moeller May 1, 2002
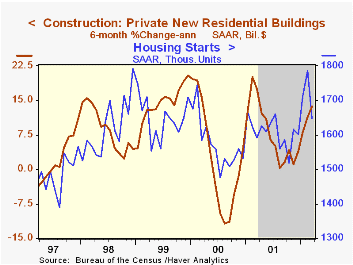
The value of construction put in place fell unexpectedly in March. The February gain was revised down due to lowered figures for residential and nonresidential building.
Residential building rose for the fourth consecutive month, though the March gain was mild compared to huge gains in January and February.
In the nonresidential sector, industrial building continued to tumble, office building rose for the first month in five and hospital construction was strong.
Spending by governments fell for the first month in six (February was revised up) due to across the board declines.
| Construction Put-in-place | Mar | Feb | Y/Y | 2001 | 2000 | 1999 |
|---|---|---|---|---|---|---|
| Total | -0.9% | 0.7% | 0.6% | 5.5% | 7.0% | 8.6% |
| Residential | 0.6% | 2.5% | 7.4% | 5.4% | 7.4% | 11.1% |
| Nonresidential | -0.3% | -4.8% | -19.5% | -0.3% | 8.0% | 1.9% |
| Public | -5.6% | 2.1% | 10.9% | 11.0% | 4.5% | 10.1% |

Tom Moeller
AuthorMore in Author Profile »Prior to joining Haver Analytics in 2000, Mr. Moeller worked as the Economist at Chancellor Capital Management from 1985 to 1999. There, he developed comprehensive economic forecasts and interpreted economic data for equity and fixed income portfolio managers. Also at Chancellor, Mr. Moeller worked as an equity analyst and was responsible for researching and rating companies in the economically sensitive automobile and housing industries for investment in Chancellor’s equity portfolio. Prior to joining Chancellor, Mr. Moeller was an Economist at Citibank from 1979 to 1984. He also analyzed pricing behavior in the metals industry for the Council on Wage and Price Stability in Washington, D.C. In 1999, Mr. Moeller received the award for most accurate forecast from the Forecasters' Club of New York. From 1990 to 1992 he was President of the New York Association for Business Economists. Mr. Moeller earned an M.B.A. in Finance from Fordham University, where he graduated in 1987. He holds a Bachelor of Arts in Economics from George Washington University.
More Economy in Brief


