 Global| Jun 02 2008
ISM Factory Sector Index Rose Unexpectedly; Level Still Indicates Contraction
by:Tom Moeller
|in:Economy in Brief
Summary
The Institute of Supply Management (ISM) reported that during May its Composite Index of Manufacturing Sector Activity rose to 49.6 from an unrevised 48.6 in April. The latest was better than Consensus expectations which had been for [...]
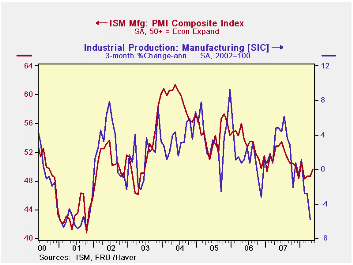
The Institute of Supply Management (ISM) reported that during May its Composite Index of Manufacturing Sector Activity rose to 49.6 from an unrevised 48.6 in April. The latest was better than Consensus expectations which had been for an unchanged reading m/m. However, the index remained below the break even level for factory sector activity of 50 for the fifth month in the last six.
The index's average level of 49.0 so far this year was its lowest since early 2003.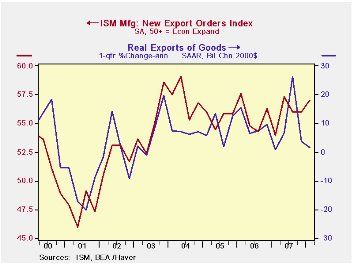
During the last twenty years there has been a 64% correlation between the level of the Composite Index and the three-month growth in factory sector industrial production.
It is appropriate to correlate the ISM index level with factory sector growth because the ISM index is a diffusion index. It measures growth by using all of the positive changes in activity added to one half of the zero change in activity measures.
The new orders index rose slightly m/m to its highest level since November of last year. The reading was, however, near the lowest level since the recession year of 2001. The production index also rose very modestly for the second month. The inventory component and the supplier delivery indexes were roughly unchanged month-to-month.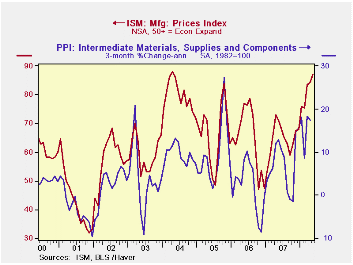
The new export orders sub-series rose moderately to 59.5 which was its highest level since early 2004. During the last ten years there has been a 53% correlation between the index and the q/q change in real exports of goods in the GDP accounts.
The employment index was about unchanged at the low reading of 45.5, near its lowest level since mid 2003. During the last twenty years there has been a 67% correlation between the level of the ISM employment index and the three-month growth in factory sector employment.
The prices paid index rose again to its highest level since early 2004. During the last twenty years there has been a 77% correlation between the price index and the three-month change in the PPI for intermediate goods.
The NBER's Business-Cycle Dating Procedure is available here.
| ISM Mfg | May | April | May '07 | 2007 | 2006 | 2005 |
|---|---|---|---|---|---|---|
| Composite Index | 49.6 | 48.6 | 52.8 | 51.1 | 53.1 | 54.4 |
| New Orders Index | 49.7 | 46.5 | 58.6 | 54.3 | 55.4 | 57.4 |
| Employment Index | 45.5 | 45.4 | 51.4 | 50.5 | 51.7 | 53.6 |
| Prices Paid Index (NSA) | 87.0 | 84.5 | 71.0 | 64.6 | 65.0 | 66.4 |

Tom Moeller
AuthorMore in Author Profile »Prior to joining Haver Analytics in 2000, Mr. Moeller worked as the Economist at Chancellor Capital Management from 1985 to 1999. There, he developed comprehensive economic forecasts and interpreted economic data for equity and fixed income portfolio managers. Also at Chancellor, Mr. Moeller worked as an equity analyst and was responsible for researching and rating companies in the economically sensitive automobile and housing industries for investment in Chancellor’s equity portfolio. Prior to joining Chancellor, Mr. Moeller was an Economist at Citibank from 1979 to 1984. He also analyzed pricing behavior in the metals industry for the Council on Wage and Price Stability in Washington, D.C. In 1999, Mr. Moeller received the award for most accurate forecast from the Forecasters' Club of New York. From 1990 to 1992 he was President of the New York Association for Business Economists. Mr. Moeller earned an M.B.A. in Finance from Fordham University, where he graduated in 1987. He holds a Bachelor of Arts in Economics from George Washington University.
More Economy in Brief


