 Global| Dec 01 2003
ISM Factory Index a Barnburner
by:Tom Moeller
|in:Economy in Brief
Summary
The Purchasing Managers Composite Index (PMI) released by the Institute of Supply Management jumped to the highest level since December 1983. Rising to 62.8 in November, the reading confirmed that recovery in the factory sector is [...]
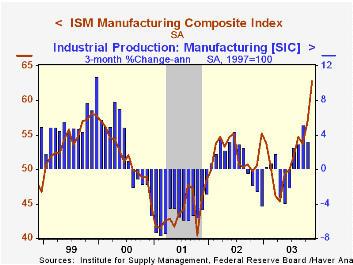
The Purchasing Managers’ Composite Index (PMI) released by the Institute of Supply Management jumped to the highest level since December 1983. Rising to 62.8 in November, the reading confirmed that recovery in the factory sector is underway. Consensus expectations were for a reading of 57.5.
During the last twenty years there has been an 83% correlation between the level of the PMI index and the three month growth in factory sector industrial production. There has been a 63% correlation between the level of the PMI Composite Index and quarterly growth in real GDP.
The new orders index rose to 73.7. Up 9.4 points versus October, it also was at the highest level since December 1983. The production index rose to 68.3, up eleven points in just the last two months.
The employment index (51.0) pierced the breakeven level for the first month since September 2000. There has been a 72% correlation during the last ten years between the ISM employment index and the one-month change in factory sector payrolls.
The inventory index rose to 50.0. Up nearly 10 points since the Spring, it was the first reading suggesting an end to inventory decumulation since 2000.
The prices paid index rose last month to 64.0. There has been a 28% correlation between the prices paid index and the y/y change in the finished goods PPI over the last ten years. The correlation with the intermediate materials PPI has been a higher 62%.
| ISM Manufacturing Survey | Nov | Oct | Nov '02 | 2002 | 2001 | 2000 |
|---|---|---|---|---|---|---|
| Composite Index | 62.8 | 53.7 | 50.5 | 52.4 | 44.0 | 51.7 |
| New Orders Index | 73.7 | 64.3 | 52.4 | 56.7 | 46.2 | 52.0 |
| Prices Paid Index (NSA) | 64.0 | 58.5 | 53.0 | 57.6 | 42.9 | 64.8 |
by Tom Moeller December 1, 2003
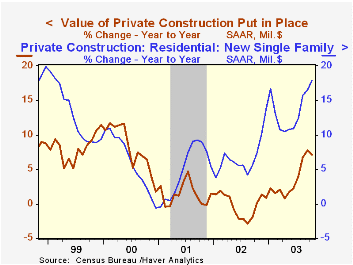
The value of total construction put in place added another 0.9% (7.0% y/y) in October to the strong gains of the prior four months. A 0.5% rise had been expected by the Consensus.
Private residential building activity surged 2.2% and pulled the year-to-date level up 9.7%. Single family home building rose 2.6% in October and was up 13.7% YTD.
Nonresidential building activity fell 2.1% as commercial construction fell 2.5% (-3.1% y/y) and education spending fell 3.4% (1.8% y/y). Office construction rose 0.6% (-12.2% y/y) and managed the third gain in as many months
These more detailed categories represent the Census Bureau’s reclassification of construction activity into end-use groups. Finer detail is available for many of the categories; for instance, commercial construction is shown for Automotive sales and parking facilities, drugstores, building supply stores, and both commercial warehouses and mini-storage facilities. Note that start dates vary for some seasonally adjusted line items in 2000 and 2002 and that constant-dollar data are no longer computed.
| Construction Put-in-place | Oct | Sept | Y/Y | 2002 | 2001 | 2000 |
|---|---|---|---|---|---|---|
| Total | 0.9% | 1.3% | 7.0% | 1.1% | 2.7% | 8.3% |
| Private | 0.8% | 1.5% | 7.1% | -0.2% | 1.4% | 8.0% |
| Residential | 2.2% | 1.5% | 12.6% | 8.6% | 3.3% | 7.4% |
| Nonresidential | -2.1% | 1.6% | -3.6% | -13.0% | -1.3% | 8.9% |
| Public | 1.2% | 0.8% | 6.6% | 5.3% | 7.4% | 9.5% |

Tom Moeller
AuthorMore in Author Profile »Prior to joining Haver Analytics in 2000, Mr. Moeller worked as the Economist at Chancellor Capital Management from 1985 to 1999. There, he developed comprehensive economic forecasts and interpreted economic data for equity and fixed income portfolio managers. Also at Chancellor, Mr. Moeller worked as an equity analyst and was responsible for researching and rating companies in the economically sensitive automobile and housing industries for investment in Chancellor’s equity portfolio. Prior to joining Chancellor, Mr. Moeller was an Economist at Citibank from 1979 to 1984. He also analyzed pricing behavior in the metals industry for the Council on Wage and Price Stability in Washington, D.C. In 1999, Mr. Moeller received the award for most accurate forecast from the Forecasters' Club of New York. From 1990 to 1992 he was President of the New York Association for Business Economists. Mr. Moeller earned an M.B.A. in Finance from Fordham University, where he graduated in 1987. He holds a Bachelor of Arts in Economics from George Washington University.
More Economy in Brief


