 Global| Feb 05 2004
Initial Jobless Insurance Claims Up In Latest Week
by:Tom Moeller
|in:Economy in Brief
Summary
Initial claims for jobless insurance rose last week by 17,000 to 356,000. The prior week's level was revised down. Consensus expectations had been for claims of 342,000. The four-week moving average of initial claims was unchanged at [...]
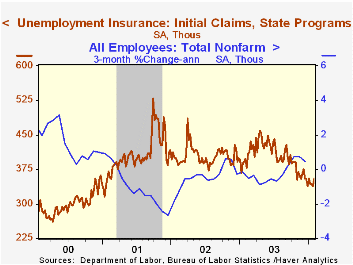
Initial claims for jobless insurance rose last week by 17,000 to 356,000. The prior week's level was revised down. Consensus expectations had been for claims of 342,000.
The four-week moving average of initial claims was unchanged at 345,250 (-10.7% y/y).
Continuing claims for unemployment insurance were unchanged w/w and the prior week's level was revised down to a smaller increase of 4,000 versus the initial report.
The insured rate of unemployment was stable at 2.5% for the fourth consecutive week.
| Unemployment Insurance (000s) | 01/31/04 | 01/24/04 | Y/Y | 2003 | 2002 | 2001 |
|---|---|---|---|---|---|---|
| Initial Claims | 356.0 | 339.0 | -10.6% | 403 | 404 | 406 |
| Continuing Claims | -- | 3,123 | -9.1% | 3,535 | 3,575 | 3,022 |
by Tom Moeller February 5, 2004
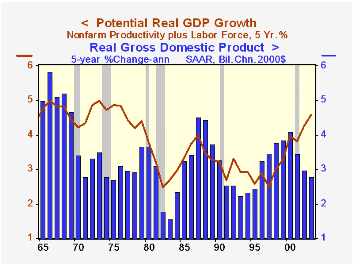
Non-farm labor productivity grew 2.7% last quarter. That was a sharp slowdown from the 9.5% growth in 3Q but came despite a surge in hours and a slowdown in output. Consensus expectations had been for 2.7% growth.
Hours worked by all persons (employment times hours) rose 1.5% (-0.2% y/y), the strongest gain since early 2000. Output growth slowed considerably to 4.2% (5.2% y/y) from 10.4% in 3Q.
On an annual basis, the five-year growth in productivity rose to 3.3% through 2003, the fastest since the mid-1960s. Combined with 1.3% growth in the labor force over that period it suggests potential growth for the economy of 4.6%.
Unit labor costs fell 1.3% and for the year fell 1.2%. The back-to-back annual declines in costs were a record.
Manufacturing sector productivity growth rose 4.8% (5.2% y/y). Unit labor costs in the factory sector fell 3.1% (-0.9%).
"Is There a Digital Divide" from the Federal Reserve Bank of San Francisco discusses who uses computers in this report.
| Non-farm Business Sector (SAAR) | 4Q '03 | 3Q '03 | Y/Y | 2003 | 2002 | 2001 |
|---|---|---|---|---|---|---|
| Output per Hour | 2.7% | 9.5% | 5.3% | 4.2% | 4.9% | 2.1% |
| Compensation | 1.3% | 3.4% | 3.3% | 2.9% | 2.2% | 3.9% |
| Unit Labor Costs | -1.3% | -5.6% | -2.0% | -1.2% | -2.5% | 1.7% |

Tom Moeller
AuthorMore in Author Profile »Prior to joining Haver Analytics in 2000, Mr. Moeller worked as the Economist at Chancellor Capital Management from 1985 to 1999. There, he developed comprehensive economic forecasts and interpreted economic data for equity and fixed income portfolio managers. Also at Chancellor, Mr. Moeller worked as an equity analyst and was responsible for researching and rating companies in the economically sensitive automobile and housing industries for investment in Chancellor’s equity portfolio. Prior to joining Chancellor, Mr. Moeller was an Economist at Citibank from 1979 to 1984. He also analyzed pricing behavior in the metals industry for the Council on Wage and Price Stability in Washington, D.C. In 1999, Mr. Moeller received the award for most accurate forecast from the Forecasters' Club of New York. From 1990 to 1992 he was President of the New York Association for Business Economists. Mr. Moeller earned an M.B.A. in Finance from Fordham University, where he graduated in 1987. He holds a Bachelor of Arts in Economics from George Washington University.
More Economy in Brief


