 Global| Jun 05 2003
Initial Jobless Insurance Claims Rose
by:Tom Moeller
|in:Economy in Brief
Summary
Initial claims for unemployment insurance rose more than expected last week. The 3.8% w/w rise to 442,000 was the largest weekly gain since early April and was to a five week high. Consensus expectations were for initial claims last [...]
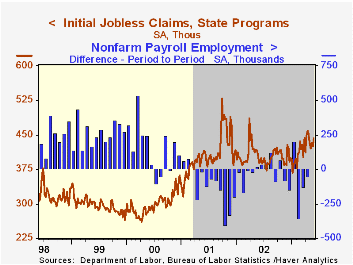
Initial claims for unemployment insurance rose more than expected last week. The 3.8% w/w rise to 442,000 was the largest weekly gain since early April and was to a five week high.
Consensus expectations were for initial claims last week of 420,000 and the prior week's level was revised up slightly.
The four-week moving average of initial claims rose to 430,500 (+5.5% y/y).
During the last ten years there has been a 67% (inverse) correlation between the level of initial jobless insurance claims and the m/m change in nonfarm payrolls to be released tomorrow.
Continuing claims for unemployment insurance fell 0.5% w/w and the prior week's level was revised down.
The insured rate of unemployment was stable at 2.9% for the sixth consecutive week and the prior week's level was revised down.
| Unemployment Insurance (000s) | 5/31/03 | 5/24/03 | Y/Y | 2002 | 2001 | 2000 |
|---|---|---|---|---|---|---|
| Initial Claims | 442.0 | 426.0 | 13.6% | 404.3 | 406.0 | 299.7 |
| Continuing Claims | -- | 3,705 | -0.2% | 3,575 | 3,022 | 2,114 |
by Tom Moeller June 5, 2003
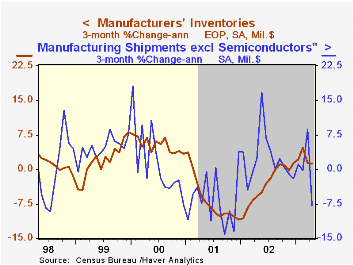
Manufacturing inventories were unchanged in April and that followed a 0.2% March decline, revised from the initial reading of no change.
This recent weakness in inventories followed meaningful accumulation from December to February, and the shift has been accompanied by resumed weakness in factory sector production. Lethargic demand (shipments) fostered the shift.
Inventories of computers and electronic products fell a sharp 1.5% (-10.1% y/y) and continued a trend of decumulation which began early in 2001. Electrical equipment inventories also fell 0.3% (-6.6% y/y) and machinery inventories were roughly unchanged (-4.7% y/y).
Nondurable goods inventories rose 0.3% (+4.4% y/y). A shift away from decumulation of nondurables occurred early last year and has been broad based.
Factory shipments fell 2.2% (-0.7% y/y). Less the huge 19.3% drop in petroleum, shipments still fell 0.8% (-1.2% y/y) with much of the weakness in the transportation sector.
Factory orders fell 2.9%. Durable goods orders fell 2.3%, little revised from the advance report.
| Factory Survey (NAICS) | April | Mar | Y/Y | 2002 | 2001 | 2000 |
|---|---|---|---|---|---|---|
| Inventories | 0.0% | -0.2% | 0.6% | -1.9% | -8.0% | 4.5% |
| New Orders | -2.9% | 2.1% | 0.4% | -0.8% | -7.2% | 5.2% |
| Shipments | -2.2% | 1.6% | -0.7% | -1.1% | -5.3% | 4.4% |

Tom Moeller
AuthorMore in Author Profile »Prior to joining Haver Analytics in 2000, Mr. Moeller worked as the Economist at Chancellor Capital Management from 1985 to 1999. There, he developed comprehensive economic forecasts and interpreted economic data for equity and fixed income portfolio managers. Also at Chancellor, Mr. Moeller worked as an equity analyst and was responsible for researching and rating companies in the economically sensitive automobile and housing industries for investment in Chancellor’s equity portfolio. Prior to joining Chancellor, Mr. Moeller was an Economist at Citibank from 1979 to 1984. He also analyzed pricing behavior in the metals industry for the Council on Wage and Price Stability in Washington, D.C. In 1999, Mr. Moeller received the award for most accurate forecast from the Forecasters' Club of New York. From 1990 to 1992 he was President of the New York Association for Business Economists. Mr. Moeller earned an M.B.A. in Finance from Fordham University, where he graduated in 1987. He holds a Bachelor of Arts in Economics from George Washington University.
More Economy in Brief


