 Global| Aug 22 2002
Initial Jobless Insurance Claims Higher Than Expected
by:Tom Moeller
|in:Economy in Brief
Summary
Initial claims for unemployment insurance were slightly higher than expected in the latest week. Claims fell slightly versus the prior week which was revised up. The latest figure covers the survey period for August nonfarm payrolls. [...]
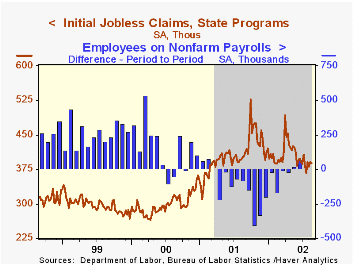
Initial claims for unemployment insurance were slightly higher than expected in the latest week. Claims fell slightly versus the prior week which was revised up.
The latest figure covers the survey period for August nonfarm payrolls. Initial claims were up slightly from the July survey period.
The four-week moving average rose slightly to 388,250 but was down 14.5% from the recent April high.
Continuing claims for unemployment insurance fell slightly from the prior week which was revised down. Continuing claims were down 6.1% versus April.
The weekly insured rate of unemployment was steady at 2.8%, up slightly from the 2.7% averaged in July.
| Unemployment Insurance (000s) | 8/17/02 | 8/10/02 | Y/Y | 2001 | 2000 | 1999 |
|---|---|---|---|---|---|---|
| Initial Claims | 389.0 | 391.0 | -3.0% | 405.8 | 299.8 | 297.7 |
| Continuing Claims | -- | 3,520 | 12.6% | 3,021 | 2,114 | 2,186 |
by Tom Moeller August 22, 2002

The Weekly Leading Index of the US economy published by the Economic Cycle Research Institute (ECRI) fell for the fourth week in five, and is down 2.9% from a high reached in June.
The indicator's six-month growth rate, perhaps the more important indicator, fell to 1.5% versus 6% in late June.
Construction of the ECRI Leading Index differs from the Index of Leading Economic Indicators published by the Conference Board. Nevertheless there has been an 80% correlation between the annual percent change in the two over the last 20 years.
The components of the index are money supply plus stock & bond mutual funds, the JOC-ECRI industrial materials price index, mortgage applications, bond quality spreads, stock prices, bond yields, and initial jobless insurance claims.
The median lead of the ECRI index at business cycle peaks has been 10.5 months and at cycle troughs 3.0 months. The sideways movement of the leading index in 2002 may or may not signal something about the economy's growth rate.
| ECRI | 8/9/02 | 8/2/02 | Y/Y | 2001 | 2000 | 1999 |
|---|---|---|---|---|---|---|
| Weekly Leading Index | 120.1 | 121.4 | 0.8% | -5.0% | 0.8% | 2.4% |

Tom Moeller
AuthorMore in Author Profile »Prior to joining Haver Analytics in 2000, Mr. Moeller worked as the Economist at Chancellor Capital Management from 1985 to 1999. There, he developed comprehensive economic forecasts and interpreted economic data for equity and fixed income portfolio managers. Also at Chancellor, Mr. Moeller worked as an equity analyst and was responsible for researching and rating companies in the economically sensitive automobile and housing industries for investment in Chancellor’s equity portfolio. Prior to joining Chancellor, Mr. Moeller was an Economist at Citibank from 1979 to 1984. He also analyzed pricing behavior in the metals industry for the Council on Wage and Price Stability in Washington, D.C. In 1999, Mr. Moeller received the award for most accurate forecast from the Forecasters' Club of New York. From 1990 to 1992 he was President of the New York Association for Business Economists. Mr. Moeller earned an M.B.A. in Finance from Fordham University, where he graduated in 1987. He holds a Bachelor of Arts in Economics from George Washington University.
More Economy in Brief


