 Global| Jul 01 2004
Initial Claims Unemployment Insurance Stable
by:Tom Moeller
|in:Economy in Brief
Summary
Initial claims for jobless insurance were about stable last week at 351,000. The prior week's level was revised up slightly. Consensus expectations had been for 344,000 claims. The 4-week moving average of initial claims rose to [...]
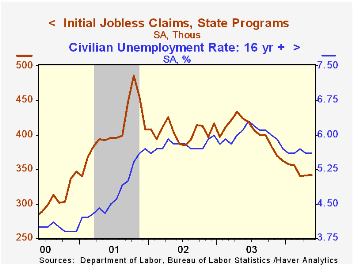
Initial claims for jobless insurance were about stable last week at 351,000. The prior week's level was revised up slightly. Consensus expectations had been for 344,000 claims.
The 4-week moving average of initial claims rose to 347,000 (-17.2% y/y).
Continuing claims for unemployment insurance rose 13,000 following a 61,000 increase the prior week which was revised down slightly.
The insured rate of unemployment rose slightly to 2.4% from the prior week that was revised down.
"Wage and Employer Changes Over the Life Cycle" from the Federal Reserve Bank of Cleveland can be found here.
| Unemployment Insurance (000s) | 6/26/04 | 6/19/04 | Y/Y | 2003 | 2002 | 2001 |
|---|---|---|---|---|---|---|
| Initial Claims | 351 | 350 | -17.8% | 403 | 404 | 406 |
| Continuing Claims | -- | 2,966 | -19.6% | 3,533 | 3,573 | 3,023 |
by Tom Moeller July 1, 2004
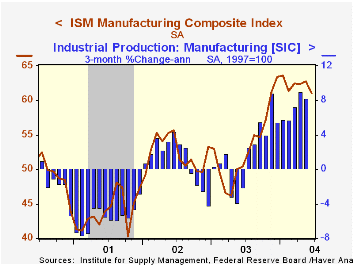
The Institute of Supply Management reported that the Purchasing Managers’ Composite Index (PMI) for June fell to 61.1 from 62.8 in May. The decline about matched Consensus expectations for a decline to 61.5.
During the last twenty years there has been a 71% correlation between the level of the Composite Index and the three month growth in factory sector industrial production.
Each of the component series fell m/m with the exception of inventories which broached the breakeven line of 50 for the first month since January 2000. New orders fell three points to the lowest level in nearly a year. New export orders similarly fell to the lowest level since February. Employment eased just moderately, down 2.2 points to 59.7.
The separate index of prices paid fell for the second month from an April high.
| ISM Manufacturing Survey | June | May | June '03 | 2003 | 2002 | 2001 |
|---|---|---|---|---|---|---|
| Composite Index | 61.1 | 62.8 | 50.4 | 53.3 | 52.4 | 43.9 |
| New Orders Index | 60.0 | 62.8 | 52.9 | 58.1 | 56.6 | 46.1 |
| Prices Paid Index (NSA) | 81.0 | 86.0 | 56.5 | 59.6 | 57.6 | 42.9 |
by Tom Moeller July 1, 2004
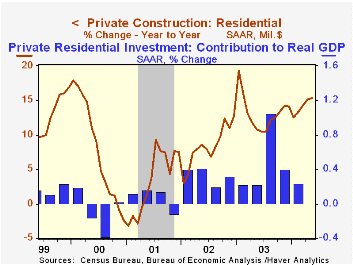
The total value of construction put in place rose 0.3% in May following a little revised 1.2% surge in April. Past figures were revised, mostly due to additional gains last year in residential construction. A 0.7% rise in May had been the Consensus expectation.
Private residential building activity rose another 0.8% following a 1.2% jump in April and a 1.1% March gain. Single family building surged 1.3% (23.7% y/y) following 1.9% and 1.6% gains the prior two months.
Nonresidential building slipped 0.4% following three months of gain. Spending on health care facilities rose 0.5% (9.9% y/y) following huge gains during the prior three months.
Public construction fell 0.2% led by a second monthly decline in the power category (+36.5% y/y). Spending on highways & streets (nearly one third of the value of public construction spending) edged up 0.1% (15.2% y/y).
These more detailed categories represent the Census Bureau’s reclassification of construction activity into end-use groups. Finer detail is available for many of the categories; for instance, commercial construction is shown for Automotive sales and parking facilities, drugstores, building supply stores, and both commercial warehouses and mini-storage facilities. Note that start dates vary for some seasonally adjusted line items in 2000 and 2002 and that constant-dollar data are no longer computed.
| Construction Put-in-place | May | April | Y/Y | 2003 | 2002 | 2001 |
|---|---|---|---|---|---|---|
| Total | 0.3% | 1.2% | 9.7% | 5.1% | 1.5% | 3.2% |
| Private | 0.4% | 1.2% | 10.7% | 6.0% | -0.2% | 1.4% |
| Residential | 0.8% | 1.2% | 15.3% | 13.1% | 8.4% | 3.3% |
| Nonresidential | 1.3% | 0.7% | 0.1% | -5.5% | -13.0% | -1.3% |
| Public | -0.2% | 1.1% | 6.6% | 2.6% | 7.0% | 10.7% |

Tom Moeller
AuthorMore in Author Profile »Prior to joining Haver Analytics in 2000, Mr. Moeller worked as the Economist at Chancellor Capital Management from 1985 to 1999. There, he developed comprehensive economic forecasts and interpreted economic data for equity and fixed income portfolio managers. Also at Chancellor, Mr. Moeller worked as an equity analyst and was responsible for researching and rating companies in the economically sensitive automobile and housing industries for investment in Chancellor’s equity portfolio. Prior to joining Chancellor, Mr. Moeller was an Economist at Citibank from 1979 to 1984. He also analyzed pricing behavior in the metals industry for the Council on Wage and Price Stability in Washington, D.C. In 1999, Mr. Moeller received the award for most accurate forecast from the Forecasters' Club of New York. From 1990 to 1992 he was President of the New York Association for Business Economists. Mr. Moeller earned an M.B.A. in Finance from Fordham University, where he graduated in 1987. He holds a Bachelor of Arts in Economics from George Washington University.
More Economy in Brief


