 Global| Jun 24 2004
Initial Claims for Unemployment Insurance Rebound
by:Tom Moeller
|in:Economy in Brief
Summary
Initial claims for jobless insurance rose 13,000 last week to 349,000. The prior week's decline of 15,000, which may have been influenced by the Reagan Funeral, was unrevised. Consensus expectations had been for 340,000 claims. The [...]

Initial claims for jobless insurance rose 13,000 last week to 349,000. The prior week's decline of 15,000, which may have been influenced by the Reagan Funeral, was unrevised. Consensus expectations had been for 340,000 claims.
The 4-week moving average of initial claims ticked up to 344,250 (-18.3% y/y).
Continuing claims for unemployment insurance rose 75,000 following a 28,000 increase the prior week which was revised down slightly.
The insured rate of unemployment rose slightly to 2.4%.
| Unemployment Insurance (000s) | 6/19/04 | 6/12/04 | Y/Y | 2003 | 2002 | 2001 |
|---|---|---|---|---|---|---|
| Initial Claims | 349 | 336 | -13.8% | 403 | 404 | 406 |
| Continuing Claims | -- | 2,967 | -18.8% | 3,533 | 3,573 | 3,023 |
by Tom Moeller June 24, 2004

Durable goods orders fell 1.6% last month versus Consensus expectations for a 1.5% increase. April orders were little revised, down 2.6%.
Weakness in transportation sector orders, down 4.1% in May and 4.6% in April, accounts for much of the slide in total orders. But orders still fell excluding the transportation sector, down 0.7% (+15.7% y/y) in May and down 1.7% in April.
Non-defense capital goods orders also were weak, off 2.6% in May and 1.2% in April. Excluding aircraft and parts orders dropped 3.0% (+10.5% y/y) following a 2.0% April skid.
During the last ten years there has been a 74% correlation between the y/y change in orders for non-defense capital goods less aircraft and the change in industrial production of capital goods.
Motor vehicle orders fell 4.0% (+8.2% y/y) following a 3.0% decline in April. That was offset by a 7.8% (-3.7% y/y) May jump in orders for aircraft & parts.
Orders for computers & electronic products slid 1.8% (+12.7% y/y) for the second month, though the April decline was revised from the -4.1% advance report. Orders for computers fell 3.6% (8.7% y/y) and orders for communications equipment dropped 12.5% (9.9% y/y).
Machinery orders also were lower, down 0.6% (+20.4% y/y), and orders for electrical equipment, appliances & components slid 3.7% (+9.9% y/y).
Shipments of durable goods fell for the second month, down 0.7% (11.7% y/y). Shipments excluding the transportation sector fell 0.9% (+13.2% y/y).
Durable inventories rose 0.4% (-0.1% y/y) for the seventh gain in the last eight months.
| NAICS Classification | May | April | Y/Y | 2003 | 2002 | 2001 |
|---|---|---|---|---|---|---|
| Durable Goods Orders | -1.6% | -2.6% | 12.6% | 2.6% | -1.7% | -10.5% |
| Non-defense Capital Goods | -2.6% | -1.2% | 12.4% | 5.6% | -7.2% | -15.5% |
by Tom Moeller June 24, 2004
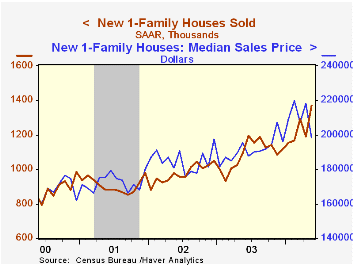
The median price of a new single family home dropped 9.0% in May to $198,400 (+1.5% y/y). It was the second m/m price decline in the last three months.
Perhaps in response, sales of new one-family homes surged 14.8% m/m in May to a new record of 1.369M. Consensus estimates had been for a lesser increase to 1.115 million. April sales were revised up.
These new home sales data from the US Census Department reflect current sales. The existing home sales figures, to be reported tomorrow, reflect closings on past sales.
Sales gains spread across the country's regions but were strongest in the Northeast where they rebounded 53.2% from a few months of softness (+63.5% y/y). Sales in the South also rose a strong 20.3% (+25.3% y/y) and sales rose 6.5% (16.3% y/y) in the West.
"Monetary Policy Transmission to Residential Investment" from this 2002 study done by the Federal Reserve Bank of New York can be found here .
"How Money Matters" from the Federal Reserve Bank of St. Louis is available here.
| Homes Sales (000s, AR) | May | April | Y/Y | 2003 | 2002 | 2001 |
|---|---|---|---|---|---|---|
| New Single-Family | 1,369 | 1,192 | 25.3% | 1,088 | 977 | 907 |
by Tom Moeller June 24, 2004
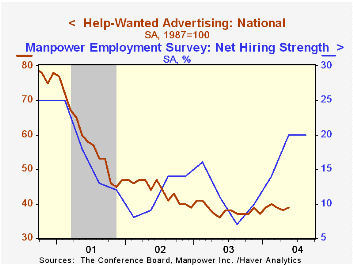
The Conference Board’s National Index of Help-Wanted Advertising rose slightly last month to 39 from 38 in April.
During the last ten years there has been a 92% correlation between the level of help-wanted advertising and the year-to-year change in non-farm payrolls.
The proportion of labor markets with rising want-ad volume improved to 69% versus 30% averaged during the prior two months.
The Conference Board surveys help-wanted advertising volume in 51 major newspapers across the country every month.
| Conference Board | May | April | May '03 |
|---|---|---|---|
| National Help Wanted Index | 39 | 38 | 36 |

Tom Moeller
AuthorMore in Author Profile »Prior to joining Haver Analytics in 2000, Mr. Moeller worked as the Economist at Chancellor Capital Management from 1985 to 1999. There, he developed comprehensive economic forecasts and interpreted economic data for equity and fixed income portfolio managers. Also at Chancellor, Mr. Moeller worked as an equity analyst and was responsible for researching and rating companies in the economically sensitive automobile and housing industries for investment in Chancellor’s equity portfolio. Prior to joining Chancellor, Mr. Moeller was an Economist at Citibank from 1979 to 1984. He also analyzed pricing behavior in the metals industry for the Council on Wage and Price Stability in Washington, D.C. In 1999, Mr. Moeller received the award for most accurate forecast from the Forecasters' Club of New York. From 1990 to 1992 he was President of the New York Association for Business Economists. Mr. Moeller earned an M.B.A. in Finance from Fordham University, where he graduated in 1987. He holds a Bachelor of Arts in Economics from George Washington University.
More Economy in Brief


