 Global| Oct 09 2003
Initial Claims For Jobless Insurance Down
by:Tom Moeller
|in:Economy in Brief
Summary
Initial claims for jobless insurance fell 23,000 to 382,000 last week. The gain reversed a 19,000 rise the prior week which was revised slightly upward from the initial report. Consensus expectations had been for claims of 395,000. [...]
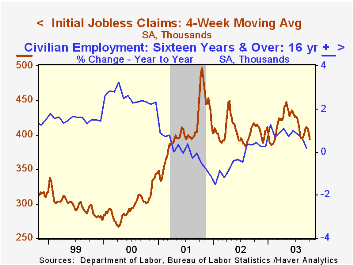
Initial claims for jobless insurance fell 23,000 to 382,000 last week. The gain reversed a 19,000 rise the prior week which was revised slightly upward from the initial report. Consensus expectations had been for claims of 395,000.
The four-week moving average of initial claims fell meaningfully to 393,500 (-5.1% y/y), the lowest level since early February.
Continuing claims for unemployment insurance fell 7,000 to 3,642,000. The claimant the prior week was revised down.
The insured rate of unemployment held steady at 2.9%. The rate has averaged 2.9% since April.
| Unemployment Insurance (000s) | 10/04/03 | 9/27/03 | Y/Y | 2002 | 2001 | 2000 |
|---|---|---|---|---|---|---|
| Initial Claims | 382.0 | 405.0 | -6.4% | 404.3 | 406.0 | 299.7 |
| Continuing Claims | -- | 3,642 | 0.8% | 3,575 | 3,022 | 2,114 |
by Tom Moeller October 9, 2003
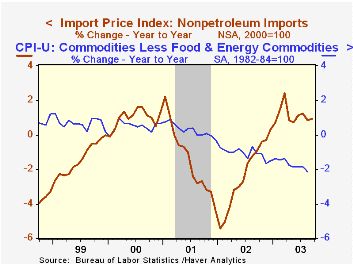
Prices for imported commodities fell in September by 0.5% (0.8% y/y). The decline was greater than Consensus expectations for a 0.2% dip.
Petroleum import prices fell 5.2% last month. Last week, the price of Brent Crude Oil was up sharply from the $26.77/bbl averaged in September.
Non-petroleum import prices rose 0.3% last month. The gain was entirely due to a 0.6% (2.3% y/y) jump in food, feeds & beverages prices. Elsewhere prices were weak. Prices for capital goods fell 0.3% (-1.3% y/y). Motor vehicle prices also dipped 0.1% (0.2% y/y) and non-auto consumer goods prices were unchanged (-0.2% y/y).
Export prices jumped 0.4% and also reflected strength in food prices which rose 5.5% (5.2% y/y). Export prices elsewhere were tame.
| Import/Export Prices (NSA) | Sept | Aug | Y/Y | 2002 | 2001 | 2000 |
|---|---|---|---|---|---|---|
| Import - All Commodities | -0.5% | 0.1% | 0.8% | -2.5% | -3.5% | 6.5% |
| Petroleum | -5.2% | 2.4% | 1.2% | 3.0% | -17.2% | 66.5% |
| Non-petroleum | 0.2% | -0.3% | 0.9% | -2.4% | -1.5% | 1.0% |
| Export - All Commodities | 0.4% | 0.0% | 1.0% | -1.0% | -0.8% | 1.6% |

Tom Moeller
AuthorMore in Author Profile »Prior to joining Haver Analytics in 2000, Mr. Moeller worked as the Economist at Chancellor Capital Management from 1985 to 1999. There, he developed comprehensive economic forecasts and interpreted economic data for equity and fixed income portfolio managers. Also at Chancellor, Mr. Moeller worked as an equity analyst and was responsible for researching and rating companies in the economically sensitive automobile and housing industries for investment in Chancellor’s equity portfolio. Prior to joining Chancellor, Mr. Moeller was an Economist at Citibank from 1979 to 1984. He also analyzed pricing behavior in the metals industry for the Council on Wage and Price Stability in Washington, D.C. In 1999, Mr. Moeller received the award for most accurate forecast from the Forecasters' Club of New York. From 1990 to 1992 he was President of the New York Association for Business Economists. Mr. Moeller earned an M.B.A. in Finance from Fordham University, where he graduated in 1987. He holds a Bachelor of Arts in Economics from George Washington University.
More Economy in Brief


