 Global| Jan 03 2005
India on a Strong Growth Trend before Tsunami Struck
Summary
Real gross domestic product in India rose 4.6% in the third quarter of 2004. So far this year, real output has averaged 7.5% over the same period of 2003. The quarterly data on India's gross domestic product are available only by [...]
Real gross domestic product in India rose 4.6% in the third quarter of 2004. So far this year, real output has averaged 7.5% over the same period of 2003.
The quarterly data on India's gross domestic product are available only by industry. Gross domestic product by expenditures is available only on a fiscal year basis. (India's fiscal year runs from April 1 to March 31.)
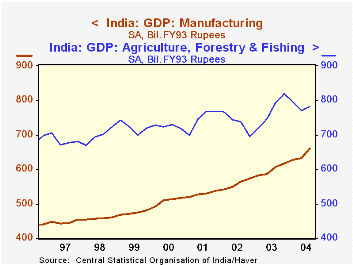
Agriculture and forestry continue to play a larger role in the Indian economy than manufacturing, as shown in the first chart. In the third quarter, agriculture and forestry accounted for just over 20% of total output and manufacturing, for 17%.
The fastest growing sectors are the two broad categories: (1) Finance, insurance, real estate and business services and (2) Trade, hotels, transportation and communications.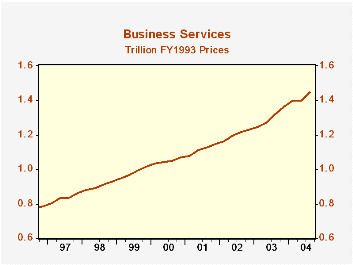
In the second chart we show the sum of these two categories as "Business Services". In the third quarter, "Business Services" amounted to almost 38% of GDP.
The tragic loss of life and devastation resulting from the tsunami has dimmed the short term outlook for the entire stricken area.
| Billions of FY '93 Rupees | Q3 04 | Q2 O4 | Q3 04 | Q/Q % | Y/Y % | % Chg 03 | % Chg 02 | % Chg 01 |
|---|---|---|---|---|---|---|---|---|
| Gross Domestic Product | 3836.43 | 3669.21 | 3597.89 | 4.56 | 6.63 | 7.00 | 4.76 | 4.47 |
| Agriculture & Forestry | 783.28 | 769.74 | 791.87 | 1.76 | -1.08 | 4.55 | -1.29 | 2.84 |
| Manufacturing | 661.88 | 633.22 | 605.80 | 4.53 | 9.26 | 7.22 | 5.46 | 3.90 |
| Fin, Ins, Real Estate & Bus Services | 483.92 | 477.15 | 447.05 | 1.42 | 5.88 | 6.52 | 7.91 | 4.42 |
| Trade, Hotels, Transport & Communications. | 962.96 | 919.85 | 862.96 | 4.69 | 11.62 | 9.58 | 7.57 | 7.40 |
More Economy in Brief


